· 8 min read
Distributed tracing: following one request through many services
- Observability
- Tracing
- OpenTelemetry
- Microservices
Contents · 10 sections
A request to a large system can touch dozens of services before it returns. When it is slow or fails, the question is always the same: where? Each service’s logs and metrics describe only its own part. Distributed tracing follows the request itself, recording every hop it makes as one connected tree, so you can see where the time went and where the error started.
This article covers the data model, the context propagation that holds a trace together across processes, how to read a trace, OpenTelemetry, the sampling decisions that make tracing affordable, and the places where traces quietly break.
Why logs and metrics aren’t enough
Metrics tell you that something is wrong: p99 latency at the gateway doubled. Logs tell you what each process did. Neither connects the two across processes. To find the cause you would have to match timestamps across a dozen services’ logs, guess which lines belong to the same request, and hope the clocks agree. Tracing makes that join explicit by giving every request an id and passing it along.
Traces and spans
The model comes from Google’s Dapper paper (Sigelman et al., 2010), building on earlier research systems such as X-Trace. A trace is the tree of work done for one request. Each node is a span: one operation, with a start time and a duration. A span records:
- the trace id, shared by every span in the trace;
- its own span id, and the span id of its parent, which builds the tree;
- a name, such as
GET /orders/:idorSELECT orders; - attributes (key-value pairs: HTTP status, database statement, order id), timed events within the span, and a status.
Spans are reported independently by each process, often seconds apart, and the tracing backend assembles the tree from the parent ids.
Context propagation
For a downstream span to know its parent, the caller must send the trace id and its own span id with the request. The W3C Trace Context standard defines how, for HTTP, in a traceparent header:
traceparent: 00-4bf92f3577b34da6a3ce929d0e0e4736-00f067aa0ba902b7-01
             │  │                                │                └ flags: 01 = sampled
             │  │                                └ parent span id (8 bytes, hex)
             │  └ trace id (16 bytes, hex)
             └ version
Propagation has to happen at two kinds of boundary:
- Between processes: HTTP and gRPC headers, and message headers on queues, so a consumer’s span joins the trace of the producer.
- Within a process: the “current span” must follow the request through async code, thread pools and callbacks. Languages provide this with context objects (Go’s
context.Context) or implicit async-local storage (Node’sAsyncLocalStorage, Java’s thread locals plus executor wrappers).
Alongside traceparent, tracestate carries vendor-specific data, and baggage carries application key-values (a tenant id, a feature flag) to every downstream service. Baggage is sent on every request, so keep it small and never put secrets in it.
Reading a trace
A waterfall view answers most performance questions at a glance:
- The critical path: the chain of spans that determines the total duration. Speeding up anything off it, like the pricing call in Fig. 1, changes nothing for the user.
- Sequential calls that could be parallel: a staircase of independent spans.
- N+1 patterns: fifty identical short database spans under one request.
- Gaps: time inside a parent not covered by any child. It is usually queueing, garbage collection, lock contention, or work that isn’t instrumented.
- Retries and fan-out: repeated sibling spans to the same service, which explain a lot of surprising load.
At scale, the value moves from single traces to aggregates: comparing slow traces against fast ones to find which attribute or service they have in common. Facebook’s Canopy (Kaldor et al., 2017) is built around exactly this kind of analysis.
OpenTelemetry
OpenTelemetry (OTel), formed in 2019 from the merger of OpenTracing and OpenCensus, is now the standard way to produce traces, and increasingly metrics and logs. Its pieces:
- API and SDK per language. Libraries instrument against the API, which does nothing until an application installs the SDK, so instrumentation costs nothing when unused.
- Auto-instrumentation for common frameworks and clients: HTTP servers, gRPC, database drivers, queues. It produces most spans without code changes.
- Semantic conventions: standard attribute names (
http.response.status_code,db.system), so dashboards and queries work across languages and vendors. - OTLP, the wire protocol, and the Collector, a pipeline that receives, processes (batching, filtering, redacting, sampling) and exports telemetry to any backend.
The practical benefit is decoupling: instrument once with OTel, and choose or change backends (Jaeger, Tempo, Honeycomb, Datadog and others) in the Collector’s configuration.
Sampling
Tracing every request at high traffic is expensive to send, store and index. Dapper sampled 1 in 1,024. The hard question is which traces to keep.
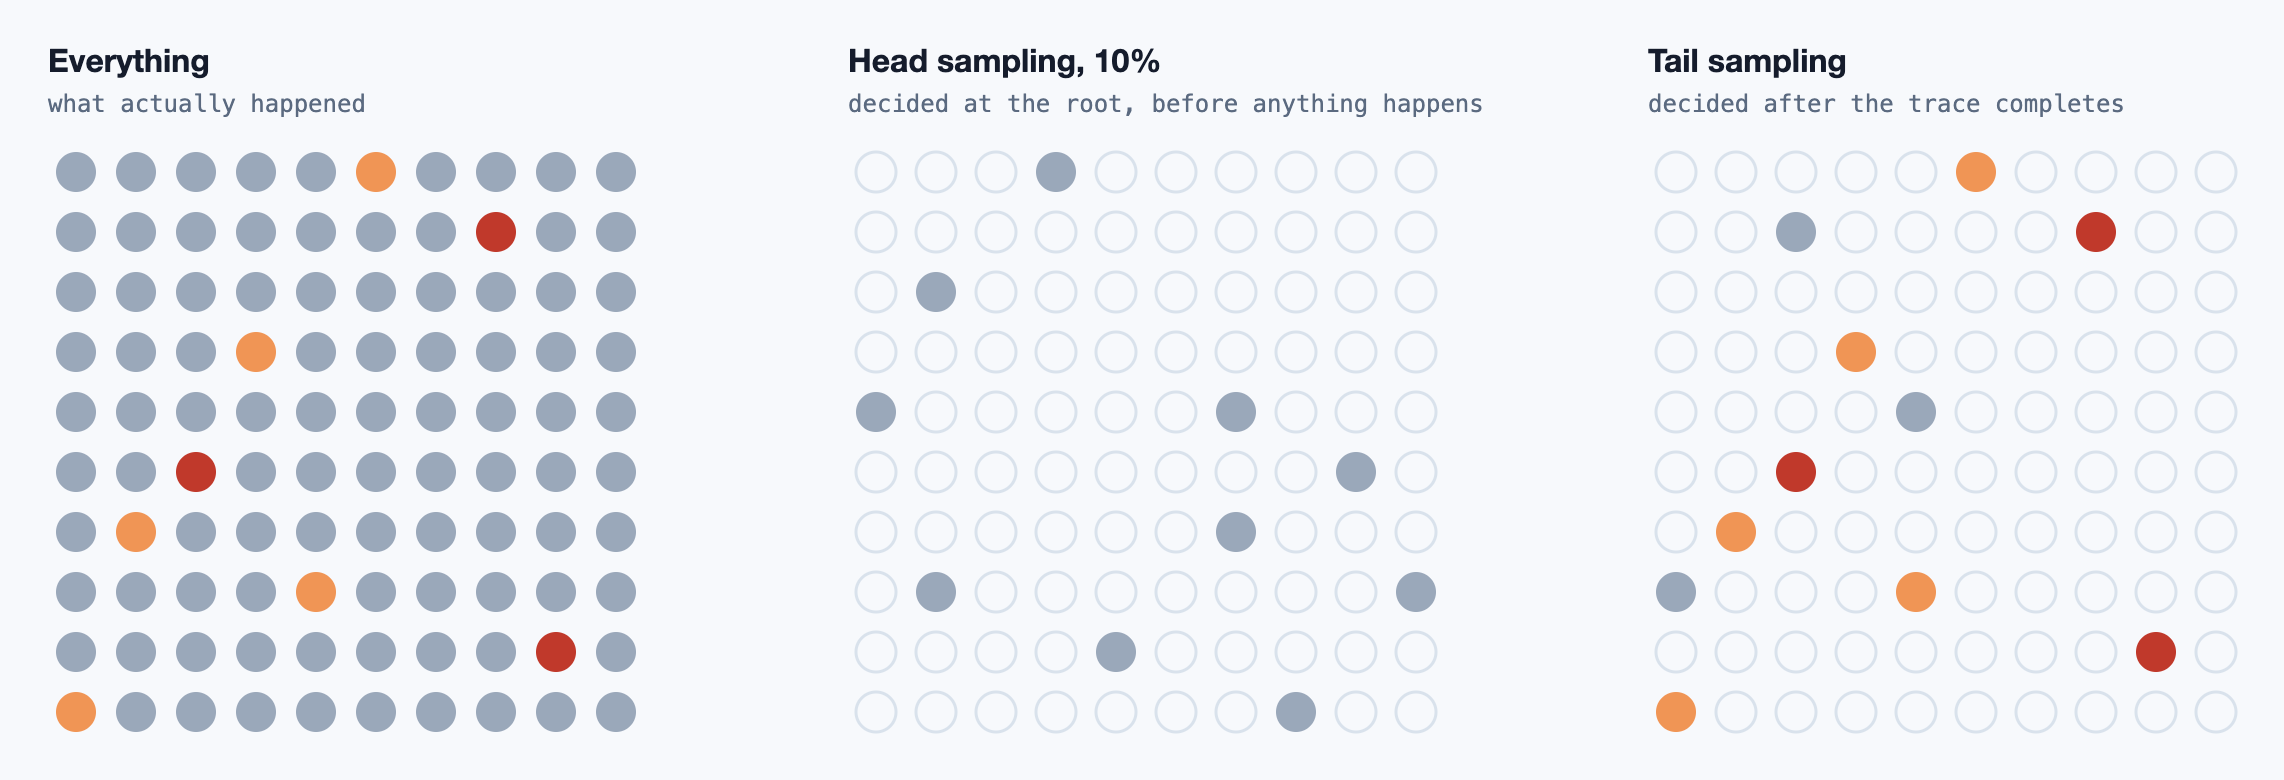
- Head sampling decides at the root, usually with a probability, and records the decision in the
sampledflag oftraceparent. Every downstream service follows it (“parent-based” sampling), so traces are either complete or absent. It is cheap, but blind: errors and slow requests are kept only at the base rate. - Tail sampling keeps everything until the trace is complete, then decides: keep all errors, everything over the latency objective, and a small random baseline. The catch is that all spans of a trace must reach the same collector, so collectors are load-balanced by trace id, and they must hold spans in memory until they decide a trace is finished.
Joining traces, metrics and logs
The three signals are most useful when they point to each other:
- Trace ids in logs. Log libraries can stamp the current trace and span id on every line, so a trace links to exactly the logs written during it.
- Exemplars. A latency histogram stores, for some buckets, the id of a trace that landed there. Click the spike in the p99 graph and open a trace that caused it.
- Span events instead of free-form logs, for things that happen inside an operation, such as a retry or a cache miss, so they appear on the timeline where they happened.
Where tracing breaks
- Lost context. A thread pool, queue, batch job or uninstrumented proxy that drops the headers splits one trace into several orphans. The symptom is root spans that clearly aren’t roots. For batch consumers that combine many messages, use span links to each producer instead of a single parent.
- Clock skew. Each span is timed by its own host’s clock. A child can appear to start before its parent. Durations within one host are reliable; offsets between hosts are approximate.
- Cardinality and cost. Attributes are cheap; indexing them isn’t. Put user ids in span attributes, not in span names or metric labels.
- Sensitive data. Database statements, URLs and headers end up in spans. Redact them in the Collector before they leave your network.
- Partial adoption. A trace is only as complete as its least instrumented hop. Gaps in the middle of a call chain are the most misleading of all.
Instrumenting by hand
Auto-instrumentation creates spans for HTTP and database calls. A queue in between is the most common place traces break, so here is propagation across one, by hand: inject the context into message headers on the producer, extract it on the consumer, and record errors on the span.
// Manual instrumentation with the OpenTelemetry API. Auto-instrumentation covers HTTP,
// gRPC and database clients; you add spans for your own units of work, and propagate
// context yourself across boundaries the libraries don't know about, like a queue.
import { context, propagation, trace, SpanKind, SpanStatusCode } from "@opentelemetry/api";

const tracer = trace.getTracer("orders");

// Producer: start a span, and put its context in the message headers.
export async function publishOrderPlaced(order: Order) {
  await tracer.startActiveSpan("orders publish", { kind: SpanKind.PRODUCER }, async (span) => {
    const headers: Record<string, string> = {};
    propagation.inject(context.active(), headers); // writes traceparent (and tracestate, baggage)
    span.setAttribute("messaging.destination.name", "orders");
    span.setAttribute("order.id", order.id); // an id, not the customer's name or email
    await queue.send({ topic: "orders", headers, value: JSON.stringify(order) });
    span.end();
  });
}

// Consumer: rebuild the context from the headers, so this span joins the same trace.
export async function onMessage(msg: { headers: Record<string, string>; value: string }) {
  const parent = propagation.extract(context.active(), msg.headers);
  await context.with(parent, () =>
    tracer.startActiveSpan("orders process", { kind: SpanKind.CONSUMER }, async (span) => {
      try {
        await reserveStock(JSON.parse(msg.value)); // spans started in here are children
      } catch (err) {
        span.recordException(err as Error);
        span.setStatus({ code: SpanStatusCode.ERROR });
        throw err;
      } finally {
        span.end();
      }
    }),
  );
}
References
- Sigelman, B. H. et al. (2010). Dapper, a Large-Scale Distributed Systems Tracing Infrastructure. Google Technical Report. research.google
- Fonseca, R. et al. (2007). X-Trace: A Pervasive Network Tracing Framework. NSDI. usenix.org
- Kaldor, J. et al. (2017). Canopy: An End-to-End Performance Tracing And Analysis System. SOSP. doi:10.1145/3132747.3132749
- Sambasivan, R. R. et al. (2014). So, you want to trace your distributed system? Key design insights from years of practical experience. CMU-PDL-14-102. pdl.cmu.edu
- W3C (2021). Trace Context. W3C Recommendation. w3.org/TR/trace-context
- OpenTelemetry. Specification and semantic conventions. opentelemetry.io
Related reading
DevOps · 9 min read
SLOs and error budgets: turning reliability into a decision
SLIs, SLOs and SLAs, choosing what to measure and what target to set, error budgets and budget policies, multiwindow burn-rate alerting, latency objectives, and the ways SLO programmes go wrong.
DevOps · 11 min read
Infrastructure as code: state, drift and safe applies
How Terraform decides what to change, what the state file really is, reading a plan and spotting replacements, renaming without destroying, drift, splitting state to limit blast radius, and a workflow that makes applies uneventful.
DevOps · 10 min read
Kubernetes requests and limits: throttling, OOM kills and QoS
What CPU and memory requests and limits actually do, why CFS quotas throttle services that look idle, OOM kills and node-pressure eviction, QoS classes, runtimes that misread their limits, and how to choose the numbers.