· 9 min read
SLOs and error budgets: turning reliability into a decision
- SRE
- Reliability
- Observability
- Alerting
Contents · 9 sections
“How reliable should this be?” is the question every team argues about implicitly: in alert thresholds, in whether to ship on Friday, in how much time goes on reliability work versus features. Service level objectives turn that argument into a number agreed in advance, and error budgets turn the number into a rule for deciding what to do next.
This article covers how to choose what to measure and what target to set, how an error budget works and what a budget policy looks like, and how to alert on the rate the budget is being spent, which pages less and catches more than threshold alerts.
SLIs, SLOs and SLAs
Three terms, often mixed up:
- A service level indicator (SLI) is a measurement of what users experience, best expressed as a ratio: good events divided by valid events. For example, the proportion of checkout requests that succeed.
- A service level objective (SLO) is a target for that ratio over a window: 99.9% of checkout requests succeed, measured over a rolling 30 days.
- A service level agreement (SLA) is a contract with consequences, usually service credits, if a target is missed. SLAs are a business decision. They should be looser than the internal SLO, so the team hears about trouble well before the lawyers do.
Choosing what to measure
A good SLI is something a user would notice. CPU usage, queue depth and pod restarts are useful for diagnosis, but users don’t experience them; they experience failed requests and slow pages. The Google SRE Workbook suggests starting from a short menu by type of system:
- Request-driven services: availability (the proportion of requests that succeed) and latency (the proportion faster than a threshold).
- Pipelines and batch jobs: freshness (the proportion of data updated recently enough) and correctness.
- Storage: durability (the proportion of written data that can still be read back).
Where you measure matters as much as what. Server-side metrics miss requests that never reached the server: a broken load balancer, a DNS failure, a crash loop with no process to emit metrics. Measure at the load balancer if you can, and add synthetic probes from outside for the paths that matter most. Client-side measurement in the browser or app is closest to the user, though also the noisiest.
Define “good” precisely. Is a 429 a failure? Usually not, if the client exceeded its limit; usually yes, if the server shed load. Are 4xx errors failures? Normally they are the client’s fault, but a sudden spike of 404s after a deploy is your bug. Write these decisions down, because the SLI’s definition is what the whole organisation will argue from.
Choosing the target
The target is never 100%. Users can’t tell the difference between 99.99% and 100% from your service, because their own Wi-Fi, mobile network and ISP fail far more often than that. And 100% leaves no room for any change at all, since every deploy carries some risk.
Each additional nine cuts the allowed failure tenfold:
| SLO | Error budget | Total downtime allowed in 30 days |
|---|---|---|
| 99% | 1% | 7.2 hours |
| 99.5% | 0.5% | 3.6 hours |
| 99.9% | 0.1% | 43 minutes |
| 99.95% | 0.05% | 22 minutes |
| 99.99% | 0.01% | 4.3 minutes |
| 99.999% | 0.001% | 26 seconds |
Those numbers also tell you what operations each target allows. At 99.9%, a human can be paged, wake up, and roll back a bad deploy within the budget. At 99.99% there is no time for a human in the loop: detection and rollback have to be automatic, and deploys have to be gradual enough that a bad one only reaches a few users. Each nine is a different way of operating, not a little more effort.
Your dependencies bound what you can promise. A request that needs five services in series, each at 99.9%, is available at most about 99.5% of the time (see the microservices article). Start with a target close to what the service achieves today and what users have accepted, then tighten it if users or the business need more.
The error budget
The error budget is what the SLO allows to fail: 1 − SLO. At 99.9% over 30 days, it is 0.1% of requests, or the equivalent of about 43 minutes of total outage. The budget reframes reliability as a resource to spend rather than a virtue to maximise. Deploys, migrations, experiments and the occasional incident all spend it. As long as there is budget left, the team is reliable enough and should spend effort on features.
What makes the budget useful is an error budget policy: an agreement, made in advance between engineering and product, about what happens when the budget runs out. A typical policy:
- While budget remains, ship normally.
- When the budget for the window is spent, freeze feature launches except urgent fixes, and put the team’s time into the causes of the spend until the service is back within its SLO.
- If one incident consumed more than, say, 20% of the budget, it gets a postmortem with tracked actions.
- Disagreements about the policy go to a named person to decide, not to whoever argues longest.
The policy is what turns an SLO from a dashboard into a decision. Without one, a blown budget is just a red number, and the argument about whether to slow down happens in the middle of the crisis instead of before it.
Alerting on burn rate
Traditional alerts fire on a threshold, such as “error rate above 1% for 5 minutes”. That rule is both too sensitive and not sensitive enough. It pages for a five-minute blip that used a sliver of the budget, and it never fires for a steady 0.5% error rate that will quietly consume the entire month’s budget in a week.
Alerting on the SLO instead starts from the burn rate: how fast you are spending the budget compared with spending it evenly over the window.
A burn rate of 1 uses exactly the whole budget by the end of the window. At a burn rate of b, a 30-day budget lasts 30 / b days, and a period of length t at that rate uses b · t / 30 days of it. So you can choose alert thresholds by asking how much of the budget is worth waking someone for.
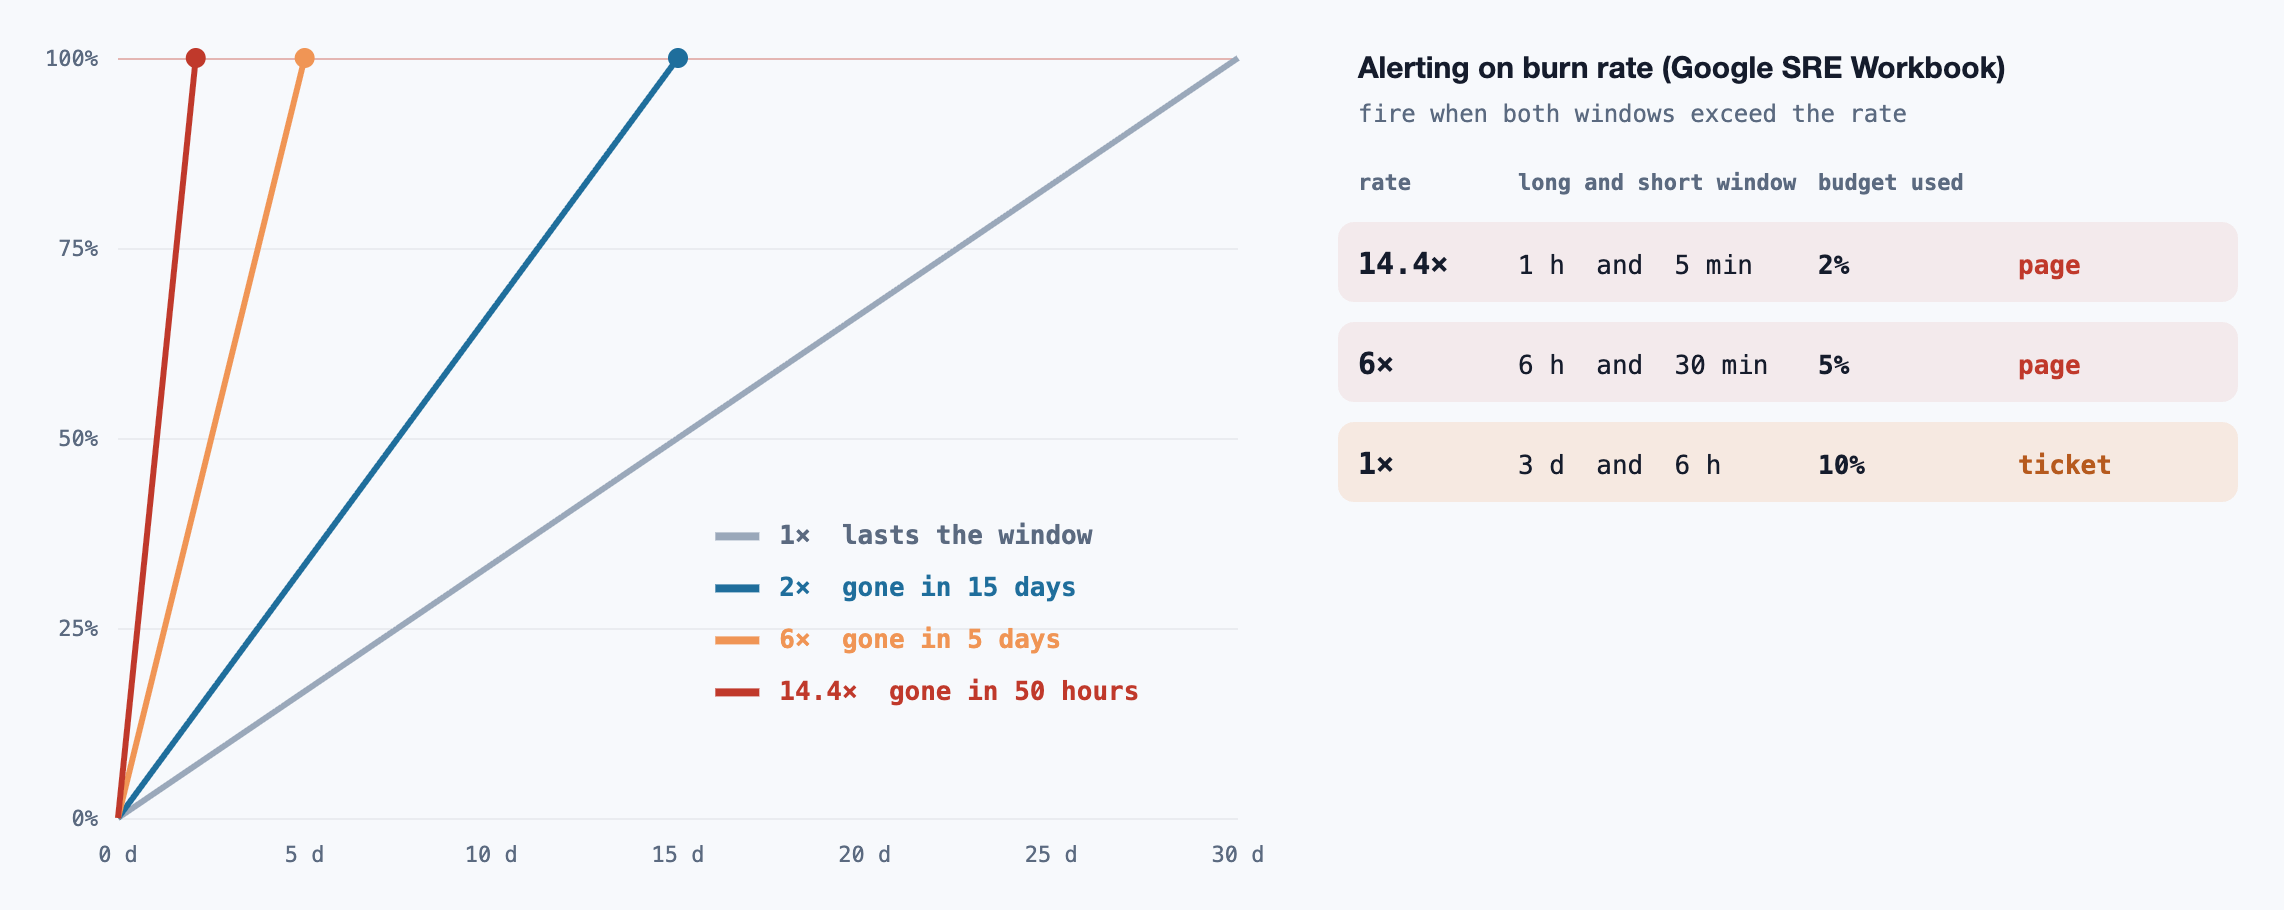
The SRE Workbook’s recommended setup uses several rules at once, each pairing a long window with a short window. The long window makes the alert precise: it only fires once a meaningful share of the budget has gone. The short window, a twelfth of the long one, makes the alert stop soon after the problem is fixed, rather than an hour later when the long window has rolled past it. The fast rule catches outages within minutes; the slow rules catch leaks that a threshold alert never would.
Latency objectives
Latency SLOs are often written as percentiles: “p99 under 300 ms”. Percentiles are fine for dashboards but awkward for budgets. You can’t average them across instances or time windows, and “p99 was 340 ms for an hour” doesn’t say how many users were affected.
The better form counts requests: “99% of requests complete in under 300 ms”. Each request is then good or bad, the SLI is a ratio like any other, and the same budget and burn-rate machinery applies unchanged. In Prometheus, this means a histogram with a bucket boundary at exactly your threshold, so you can count le="0.3" against the total. Many teams use two latency SLOs: a typical one (90% under 100 ms) and a tail one (99% under 500 ms).
Where SLOs go wrong
- Too many. An SLO on every endpoint and every internal service gives you dozens of budgets that nobody tracks. Start with the few user journeys that matter, such as sign in, search and checkout, and measure them end to end.
- Low traffic. At 100 requests an hour, one failure is 1% of the hour, and the burn-rate alerts become noise. Use longer windows, add synthetic traffic so there is always something to measure, or group low-volume endpoints into one SLO.
- Retries hide errors. If clients retry, the user may see success while the server logged a failure, or the reverse. Decide which you are measuring, and remember that a retry-amplified incident (see the retries article) inflates the denominator too.
- Measuring averages over time. “Up for 99.9% of minutes” treats a minute with 1% errors the same as a minute with none. Counting requests is more honest; time-based SLIs suit systems where requests are rare.
- No policy. An SLO with no agreed consequence for missing it is a vanity metric. The budget has to change what the team does.
Burn-rate alerts in Prometheus
The three multiwindow rules for a 99.9% availability SLO on a checkout service: recording rules for the error ratio over each window, and alerts that fire only when both the long and the short window exceed the burn rate. Tools such as Sloth and Pyrra generate these from a short SLO definition, which is less error-prone than writing them by hand.
# Recording rules: the checkout service's error ratio over each window the alerts use.
groups:
  - name: checkout-slo
    rules:
      - record: slo:error_ratio:rate5m
        expr: |
          sum(rate(http_requests_total{service="checkout", code=~"5.."}[5m]))
          /
          sum(rate(http_requests_total{service="checkout"}[5m]))
      # ...and the same for 30m, 1h, 6h and 3d: only the range changes.

  - name: checkout-slo-alerts
    rules:
      # SLO 99.9%, so the error budget is 0.001 of requests.
      # Page at 14.4x over 1h (2% of the 30-day budget), confirmed over 5m.
      - alert: CheckoutBudgetFastBurn
        expr: |
          slo:error_ratio:rate1h > (14.4 * 0.001)
          and
          slo:error_ratio:rate5m > (14.4 * 0.001)
        labels: { severity: page }
      # Page at 6x over 6h (5% of the budget), confirmed over 30m.
      - alert: CheckoutBudgetSlowBurn
        expr: |
          slo:error_ratio:rate6h > (6 * 0.001)
          and
          slo:error_ratio:rate30m > (6 * 0.001)
        labels: { severity: page }
      # A ticket for a steady leak: 1x over 3d (10% of the budget), confirmed over 6h.
      - alert: CheckoutBudgetLeak
        expr: |
          slo:error_ratio:rate3d > 0.001
          and
          slo:error_ratio:rate6h > 0.001
        labels: { severity: ticket }
References
- Beyer, B., Jones, C., Petoff, J. & Murphy, N. R. (2016). Site Reliability Engineering, ch. 3: Embracing Risk; ch. 4: Service Level Objectives. O’Reilly. sre.google/sre-book
- Beyer, B. et al. (2018). The Site Reliability Workbook, ch. 2: Implementing SLOs; ch. 5: Alerting on SLOs. O’Reilly. sre.google/workbook/alerting-on-slos
- Hidalgo, A. (2020). Implementing Service Level Objectives. O’Reilly. oreilly.com
- Google SRE. Example Error Budget Policy. sre.google/workbook/error-budget-policy
- Treynor, B., Dahlin, M., Rau, V. & Beyer, B. (2017). The Calculus of Service Availability. ACM Queue. queue.acm.org
- OpenSLO. OpenSLO specification. openslo.com
Related reading
DevOps · 8 min read
Distributed tracing: following one request through many services
Traces and spans, W3C Trace Context and how context propagates across processes and queues, reading a waterfall and its critical path, OpenTelemetry, head versus tail sampling, and the places traces quietly break.
DevOps · 9 min read
Progressive delivery: canaries, blue-green and feature flags
Why changes cause most outages, rolling, blue-green and canary deploys, running canaries with enough traffic and the right baseline, automated canary analysis, feature flags and flag debt, and the changes no rollout can make safe.
DevOps · 11 min read
Infrastructure as code: state, drift and safe applies
How Terraform decides what to change, what the state file really is, reading a plan and spotting replacements, renaming without destroying, drift, splitting state to limit blast radius, and a workflow that makes applies uneventful.