Cell Culture Petri Dish Classification
Ting Tang
27 April 2026
Contents
- 1Task
- 2Dataset
- 3Preprocessing Pipeline
- 3.1Stage 1 — YOLOv8-seg Dish Cropping
- 3.2Stage 2 — Colour Normalisation and ROI Refinement
- 4Shared Training Infrastructure
- 4.1Data Split and Class Balancing
- 4.2Online Data Augmentation
- 4.3Focal Loss
- 4.4CutMix and MixUp
- 4.5Test-Time Augmentation
- 5Approach 1 — CNNs Trained from Scratch
- 5.1A1a: PowerfulCNN
- 5.2A1b: SE-ResNet50 from Scratch
- 6Approach 2 — Fine-Tuned Pretrained Backbones
- 6.1A2a: ConvNeXt-Small Fine-Tuned
- 6.2A2b: Swin-T Fine-Tuned
- 7Approach 3 — Pretrained Embeddings + RBF-SVM
- 7.1A3a: ConvNeXt-Small Embeddings + SVM
- 7.2A3b: Swin-T Embeddings + SVM
- 8Comparative Analysis
- 8.1Overall Performance
- 8.2Per-Class Analysis
- 9Discussion
- 10Conclusion
1Task
Petri dish images are classified into 16 classes (a–q, excluding j). Three approaches are compared, each with two architectures:
- A1. Scratch CNNs
- A1a. PowerfulCNN — residual network with CBAM attention
- A1b. SE-ResNet50 — ResNet50 with squeeze-and-excitation bottlenecks
- A2. Fine-tuned Backbones
- A2a. Fine-tuned ConvNeXt-Small
- A2b. Fine-tuned Swin-T
- A3. Embeddings + SVM
- A3a. ConvNeXt-Small embeddings + SVM
- A3b. Swin-T embeddings + SVM
2Dataset
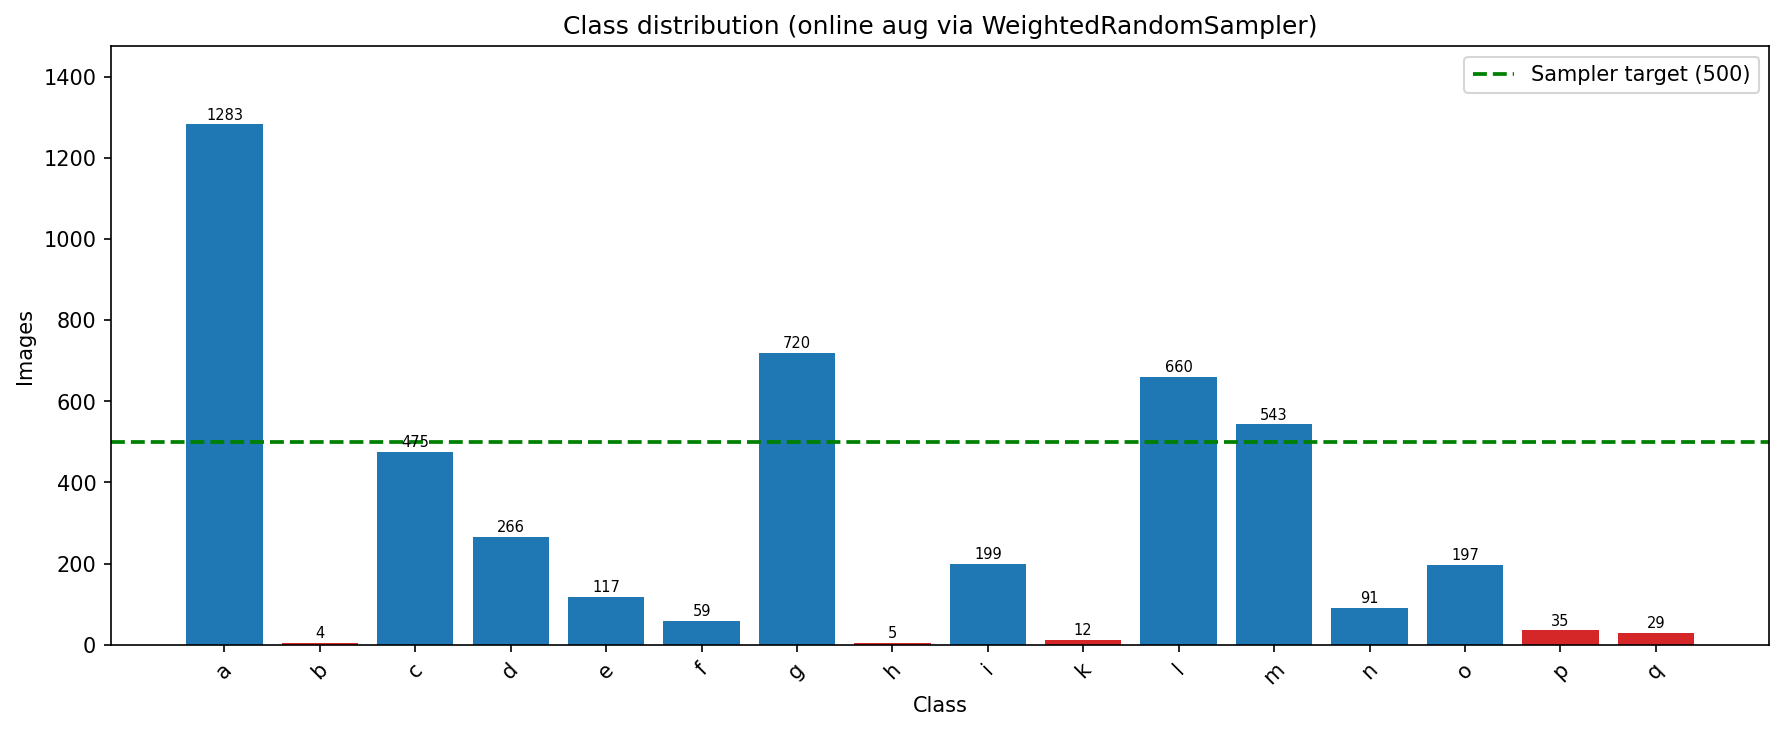
The dataset contains 4 695 labelled images across 16 classes (a–q, excluding j), supplemented by unlabelled test images. The dataset is severely imbalanced: class a dominates with 1 283 images while b has only 4, a raw imbalance ratio 1283/4 = 320×. The class distribution is shown in Figure 1.
A stratified 80/20 split yields 3 756 training samples and 939 held-out test samples.
3Preprocessing Pipeline
3.1Stage 1 — YOLOv8-seg Dish Cropping
Each raw image is processed by a YOLOv8-nano-seg model [5] fine-tuned on 128 labelme-annotated petri dish images. Selected the highest-confidence segmentation mask; pixels outside the mask are set to white; the result is tight-cropped to the mask bounding box and resized to 320×320. If no mask is detected, the full image is used unchanged (Listing 1).
def crop_dish(img: np.ndarray, seg: YOLO) -> np.ndarray:
    # Stage 1: isolate the dish with the fine-tuned YOLOv8-nano-seg model.
    r = seg(img, verbose=False)[0]
    if r.masks is None:
        return img                              # no dish found: pass through
    best = int(r.boxes.conf.argmax())           # highest-confidence mask
    h, w = img.shape[:2]
    mask = cv2.resize(r.masks.data[best].cpu().numpy(), (w, h)) > 0.5
    img = np.where(mask[..., None], img, 255)   # background -> white
    ys, xs = np.nonzero(mask)
    img = img[ys.min():ys.max() + 1, xs.min():xs.max() + 1]
return cv2.resize(img, (320, 320))3.2Stage 2 — Colour Normalisation and ROI Refinement
On the YOLOv8-cropped images, four sequential corrections are applied:
- Hough-circle ROI extraction. A Gaussian-blurred (11×11, σ = 2) greyscale image is passed to the gradient Hough transform (dp = 1.2, param1 = 70, param2 = 35, r ∈ [0.28, 0.62]⋅min(H, W)). The detected disc is expanded by 6% (r ← 1.06 r), masked to an ellipse (background = 128), and resized to 320×320. If no circle is found the image is passed through unchanged.
- CLAHE [12] on the L∗ channel of L∗a∗b∗ space (clip limit 2.0, tile grid 8×8) enhances local contrast while preserving chrominance.
- Grey-world white balance. Per-channel means over non-saturated pixels (intensity ∈ (10, 245)) are normalised to remove inter-session colour casts. For each channel c:μ = 13 Σc μc, Ic ← clip(Ic ⋅ μ/μc, 0, 255).(1)
- Non-local means denoising [1] suppresses JPEG artefacts (h = 4, patch 7, window 21).
The two-stage output is a 320×320 RGB image; Listing 2 gives the code, and representative crops are shown in Figure 2.
def normalise(img: np.ndarray) -> np.ndarray:
    # 1. Hough-circle ROI: expand the disc by 6%, mask to an ellipse.
    s = min(img.shape[:2])
    grey = cv2.GaussianBlur(cv2.cvtColor(img, cv2.COLOR_RGB2GRAY), (11, 11), 2)
    c = cv2.HoughCircles(grey, cv2.HOUGH_GRADIENT, dp=1.2, minDist=s,
                         param1=70, param2=35,
                         minRadius=int(0.28 * s), maxRadius=int(0.62 * s))
    if c is not None:
        x, y, r = c[0, 0]
        img = ellipse_roi(img, (x, y), 1.06 * r, fill=128, size=320)

    # 2. CLAHE on L* only, so chrominance is untouched.
    lab = cv2.cvtColor(img, cv2.COLOR_RGB2LAB)
    clahe = cv2.createCLAHE(clipLimit=2.0, tileGridSize=(8, 8))
    lab[..., 0] = clahe.apply(lab[..., 0])
    img = cv2.cvtColor(lab, cv2.COLOR_LAB2RGB)

    # 3. Grey-world white balance over non-saturated pixels.
    f = img.astype(np.float32)
    ok = (f.mean(-1) > 10) & (f.mean(-1) < 245)
    mu = f[ok].mean(axis=0)                     # per-channel means
    img = np.clip(f * mu.mean() / mu, 0, 255).astype(np.uint8)

    # 4. Non-local means against JPEG artefacts.
    return cv2.fastNlMeansDenoisingColored(img, None, h=4, hColor=4,
                                           templateWindowSize=7,
                                           searchWindowSize=21)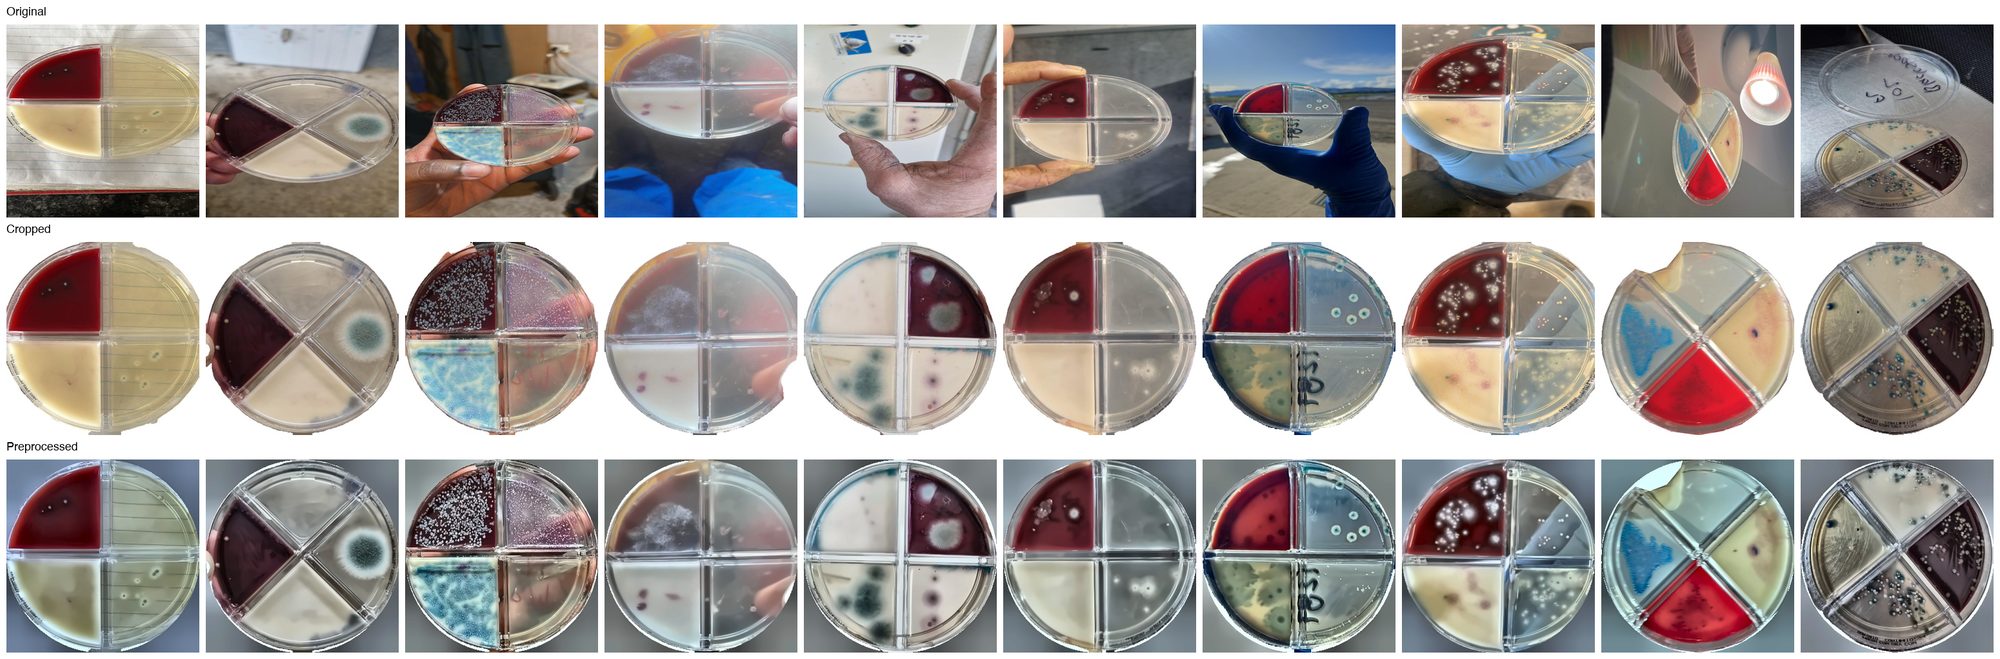
4Shared Training Infrastructure
4.1Data Split and Class Balancing
The 3 756 training originals are loaded with WeightedRandomSampler, drawing 500×16 = 8,000 samples per epoch with weight wc = 500/nc, equalising class frequency without duplicating validation data.
4.2Online Data Augmentation
Table 1 lists all transforms; fine-tuned backbones use wider rotation and crop variance and additionally apply RandomErasing.
| Transform | Parameter | Scratch CNNs (A1) | Fine-Tuned Backbones (A2) |
|---|---|---|---|
| RandomHorizontalFlip | p | 0.5 | 0.5 |
| RandomVerticalFlip | p | 0.5 | 0.5 |
| RandomRotation | degrees | ±30° | ±90° |
| RandomResizedCrop | scale, ratio | [0.9, 1.0], [0.95, 1.15] | [0.75, 1.0], [0.9, 1.1] |
| ColorJitter | b/c/s/h | 0.20/0.20/0.15/0.03 | 0.30/0.30/0.20/0.05 |
| RandomGrayscale | p | 0.05 | 0.05 |
| RandomAutocontrast | p | 0.20 | 0.25 |
| RandomAdjustSharpness | p | 0.25 | 0.25 |
| RandomErasing | p, scale | — | 0.20, [0.02, 0.15] |
4.3Focal Loss
Focal Loss [6] down-weights easy examples to keep the gradient signal focused on hard minority-class boundaries:
with label smoothing ε = 0.10 applied inside the underlying cross-entropy.
4.4CutMix and MixUp
Stochastic sample mixing per batch: CutMix (p = 0.4, Beta(1,1) λ) replaces a random rectangular region with the corresponding patch from a shuffled sample; MixUp (p = 0.3, Beta(0.2,0.2) λ) linearly blends two samples pixel-wise. The loss is the λ-weighted sum over both target labels.
Listing 3 assembles Sections 4.1–4.4 into the training loop that every model in Approaches 1 and 2 runs; what differs between them is the optimiser settings, the schedule and, in Approach 2, the frozen stages.
# 500 draws per class per epoch, whatever the class's true size.
weights = [500 / class_count[y] for y in train_labels]
sampler = WeightedRandomSampler(weights, num_samples=500 * 16)
loader = DataLoader(train_ds, BATCH, sampler=sampler)   # Table 1 transforms
criterion = FocalLoss(gamma=2.0, label_smoothing=0.10)

best_f1, wait = 0.0, 0
for epoch in range(max_epochs):
    model.train()
    for x, y in loader:
        u = random.random()
        if u < 0.4:
            x, y_a, y_b, lam = cutmix(x, y, alpha=1.0)   # Beta(1, 1)
        elif u < 0.7:
            x, y_a, y_b, lam = mixup(x, y, alpha=0.2)    # Beta(0.2, 0.2)
        else:
            y_a, y_b, lam = y, y, 1.0
        logits = model(x)
        loss = lam * criterion(logits, y_a) + (1 - lam) * criterion(logits, y_b)
        optimizer.zero_grad()
        loss.backward()
        optimizer.step()
    scheduler.step()

    f1 = macro_f1(model, holdout_loader)
    if f1 > best_f1:
        best_f1, wait = f1, 0
        torch.save(model.state_dict(), "best.pt")
    else:
        wait += 1
        if wait == patience:
break4.5Test-Time Augmentation
Test predictions use TTA: each image is evaluated under Ntta = 8 distinct geometric views and the resulting class-logit vectors are averaged before taking argmax. The eight views are the Cartesian product of:
- Rotations: 0°, 90°, 180°, 270° (applied with
torchvision.transforms.functional.rotate, preserving the original 320 × 320 canvas and filling new pixels with the ImageNet channel means). - Horizontal flip: identity vs.
hflip.
5Approach 1 — CNNs Trained from Scratch
5.1A1a: PowerfulCNN
5.1.1Architecture
PowerfulCNN is a 4-stage residual network (32.38 M parameters). The architecture is summarised in Table 2; the block design is illustrated in Figure 3.
| Layer | Output | Channels | Notes |
|---|---|---|---|
| Input | 3202 | 3 | |
| Stem (7×7 s2 + MaxPool s2) | 802 | 64 | |
| Stage 1 | 802 | 128 | stride 1 |
| Stage 2 | 402 | 256 | stride 2 |
| Stage 3 | 202 | 512 | stride 2 |
| Stage 4 | 102 | 512 | stride 2 |
| GeM Pool | 12 | 512 | learnable p |
| BN + Drop(0.20) + FC(512) + ReLU + Drop(0.10) + FC(16) | — | 16 |
(a) Standard
(b) Pre-Act + CBAM
Pre-activation ResBlocks with CBAM. Each stage uses three pre-activation residual blocks [2] (BN → ReLU before each convolution) followed by a Convolutional Block Attention Module [15] that applies sequential channel and spatial attention gates, focusing on discriminative colony regions.
Stochastic Depth [4]. Drop-path rates increase linearly from 0 to 0.15 across 12 residual blocks.
GeM Pooling [11]. A learnable Generalised Mean pooling (p initialised to 3.0) replaces global average pooling, providing richer spatial aggregation.
5.1.2Training
- Optimizer: AdamW [9], lr = 3×10⁻⁴, weight decay = 5×10⁻⁵
- Scheduler: CosineAnnealingWarmRestarts (T0 = 60, Tmult = 2, ηmin = 10−6)
- Max epochs: 60; early-stopping patience: 8 (monitor held-out macro F1)
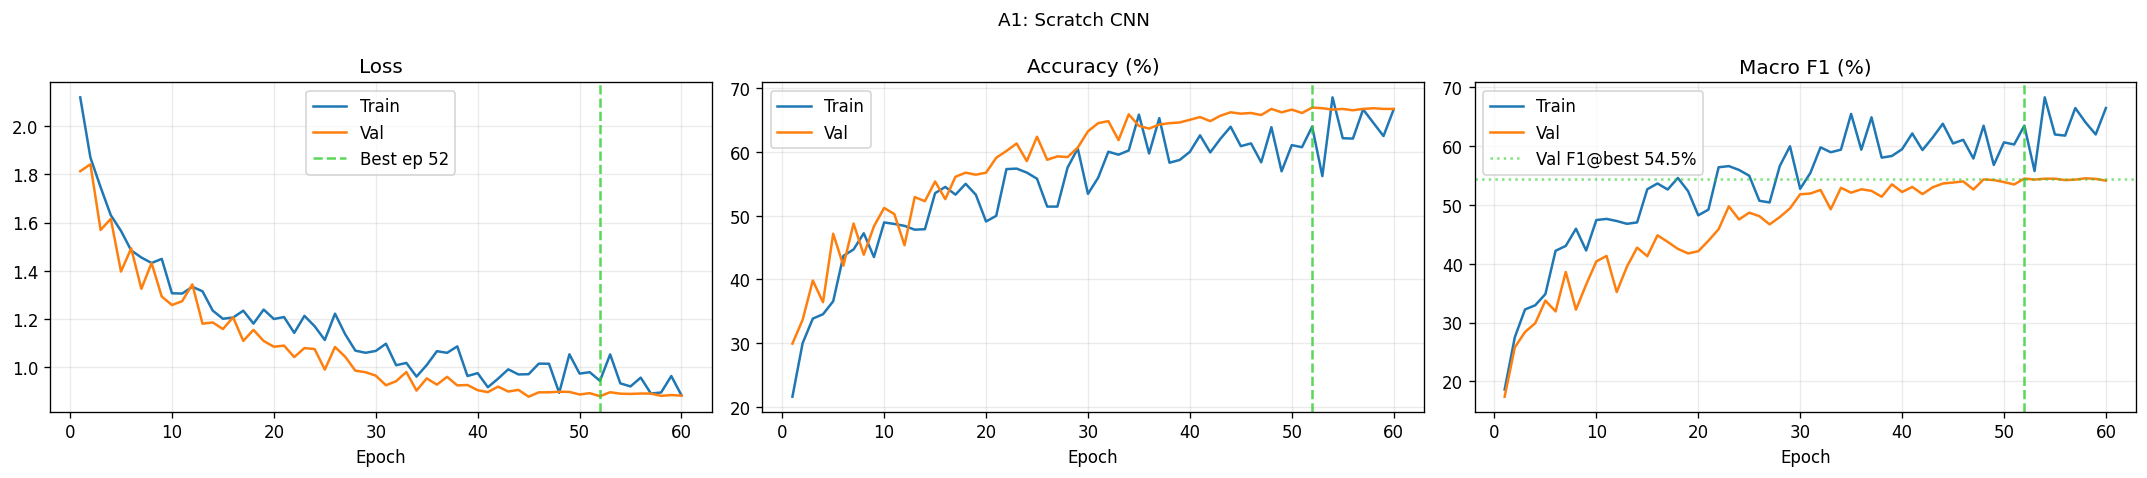
- Best checkpoint: epoch 52, held-out macro F1 = 54.49%
5.1.3Results
A1a achieves 66.99% accuracy and macro F1 of 54.49% (Table 3, Figure 4), driven by strong performance on class a (recall = 81.71%) and g (82.64%). Classes h and k collapse to 0% recall; m reaches only 27.52% recall despite substantial training support (Figure 5). Filter norms increase progressively from stage 1 to stage 4, indicating deeper stages develop more specialised representations (Figure 6).
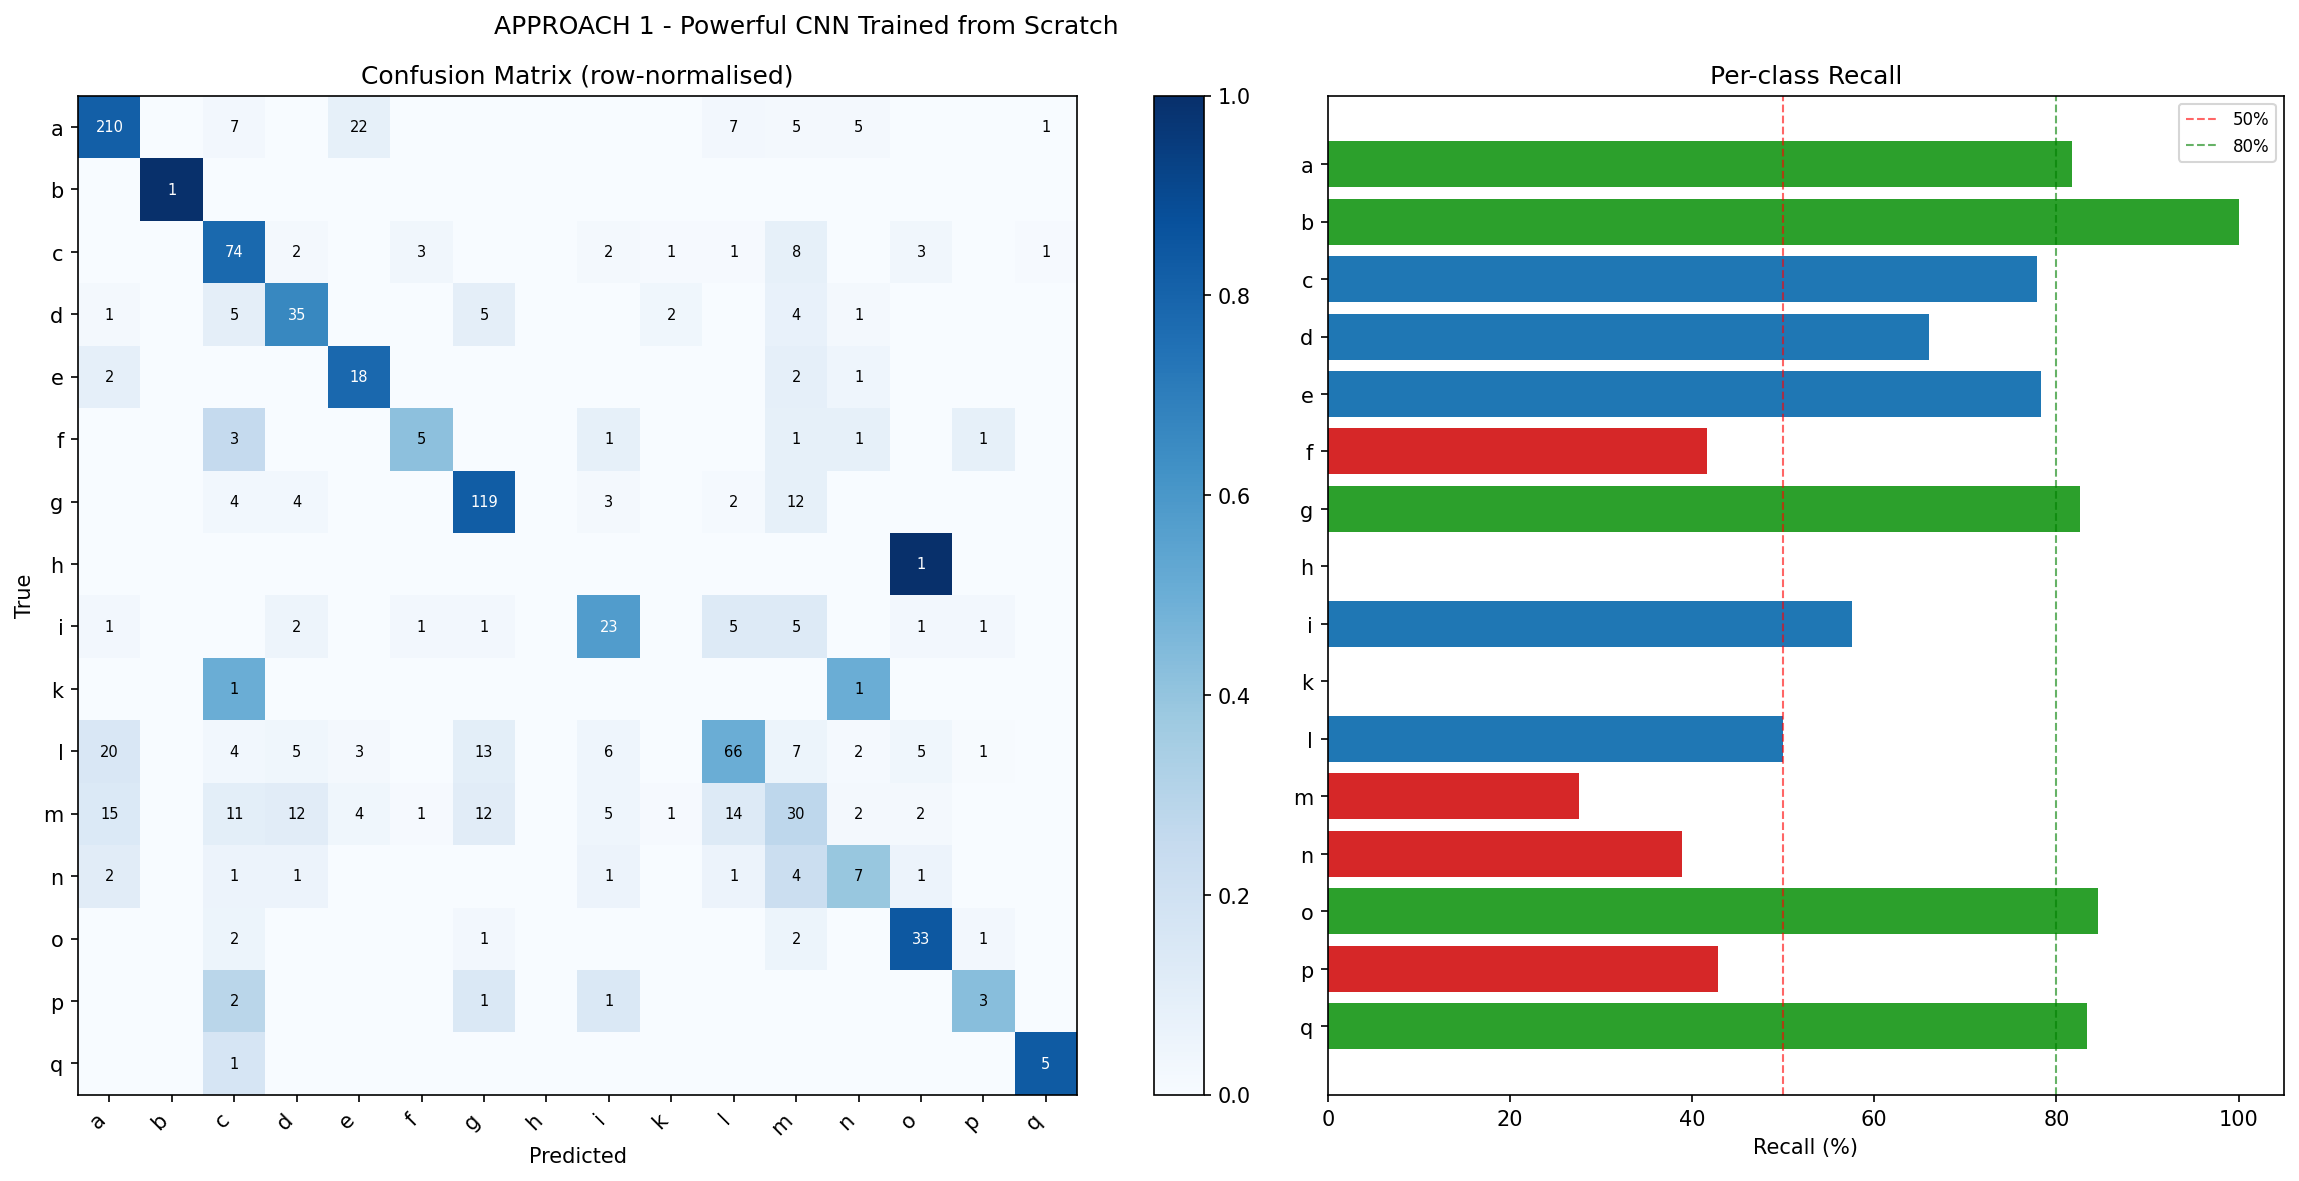
m is largely confused with n and l.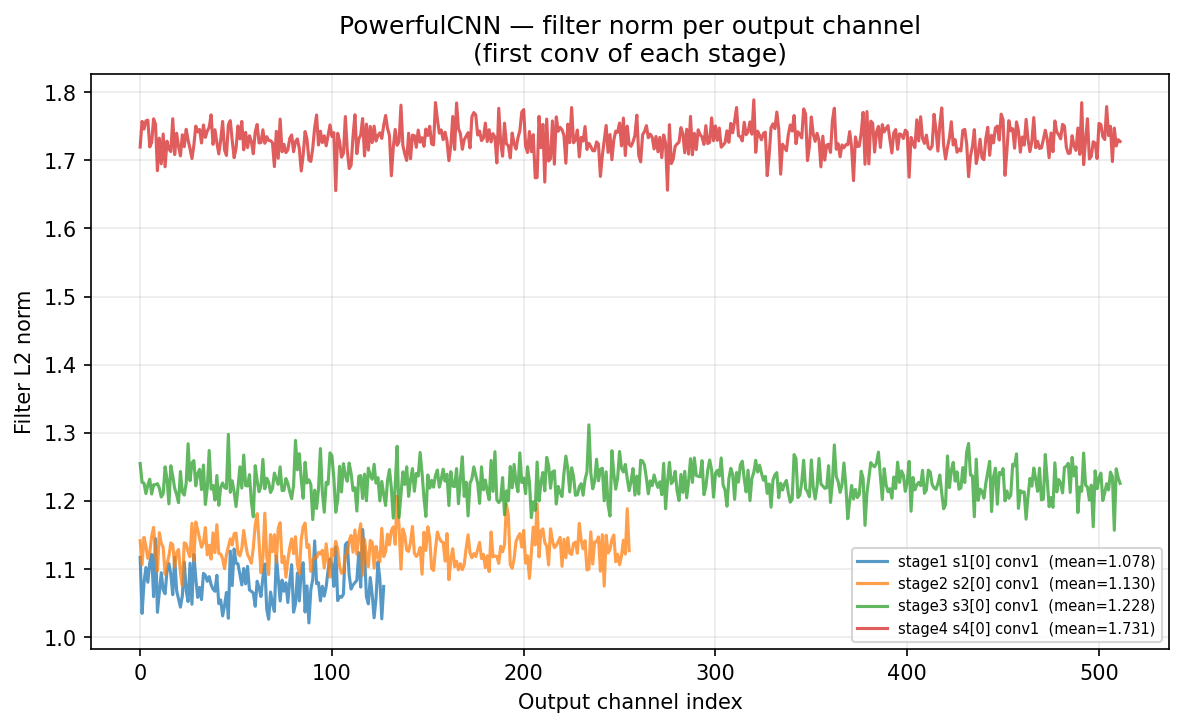
5.2A1b: SE-ResNet50 from Scratch
5.2.1Architecture
SE-ResNet50 [3] replaces each bottleneck's output with a Squeeze-and-Excitation (SE) block that recalibrates channel responses via global average pooling and a two-layer FC gating network (reduction ratio = 16). The network has 27.08 M parameters. The head replaces the ImageNet classifier with Flatten → Dropout(0.30) → FC(512) → ReLU → Dropout(0.15) → FC(16). The SE bottleneck block is illustrated in Figure 7.
(a) Standard Bottleneck
(b) SE-Bottleneck
5.2.2Training
- Optimizer, scheduler and stopping rule: as A1a (Section 5.1)
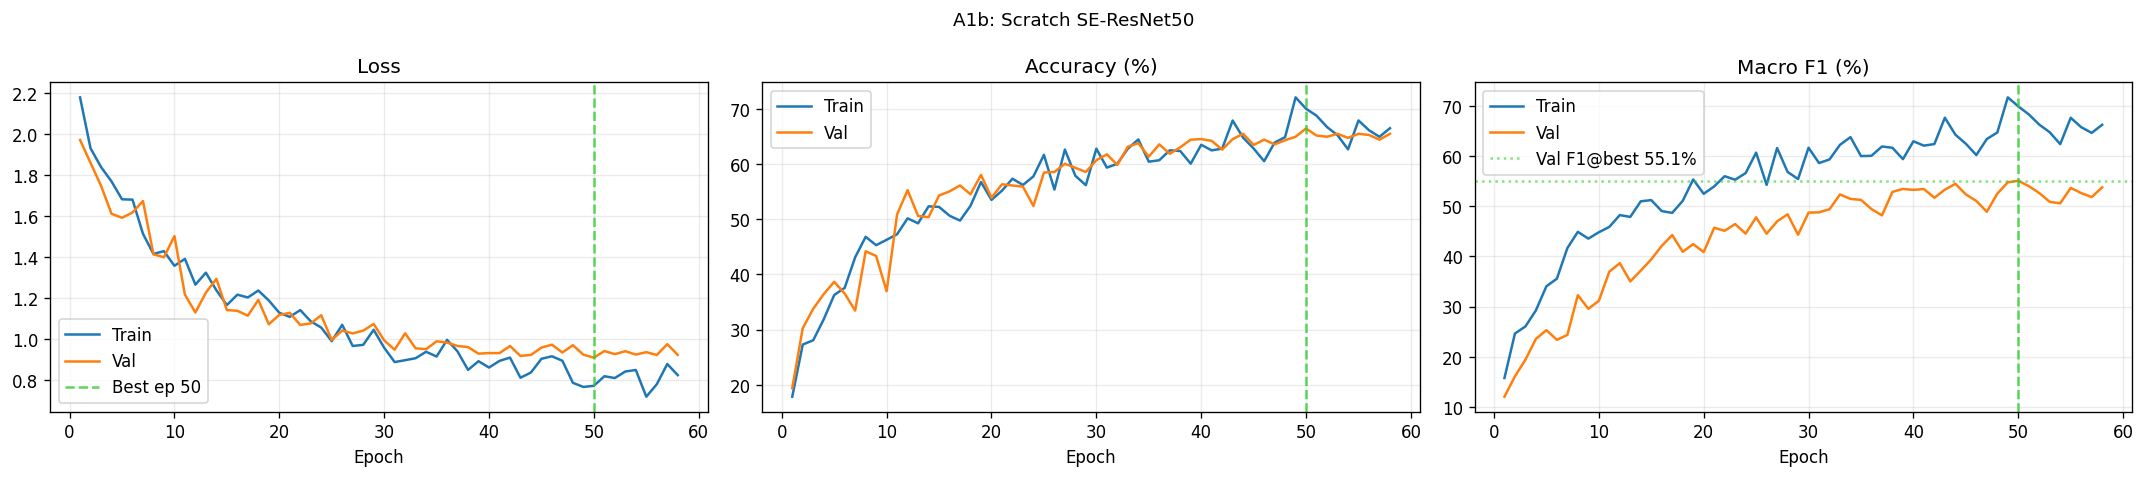
- Best checkpoint: epoch 50, held-out macro F1 = 55.07%
5.2.3Results
A1b achieves 66.45% accuracy and macro F1 of 55.07%, closely matching A1a in accuracy (−0.54 pp) while edging it by +0.58 pp macro F1 (Table 3, Figure 8, Figure 9). Layer 4 exhibits the highest mean filter norm, consistent with SE gates concentrating discriminative weight in the final stage (Figure 10).
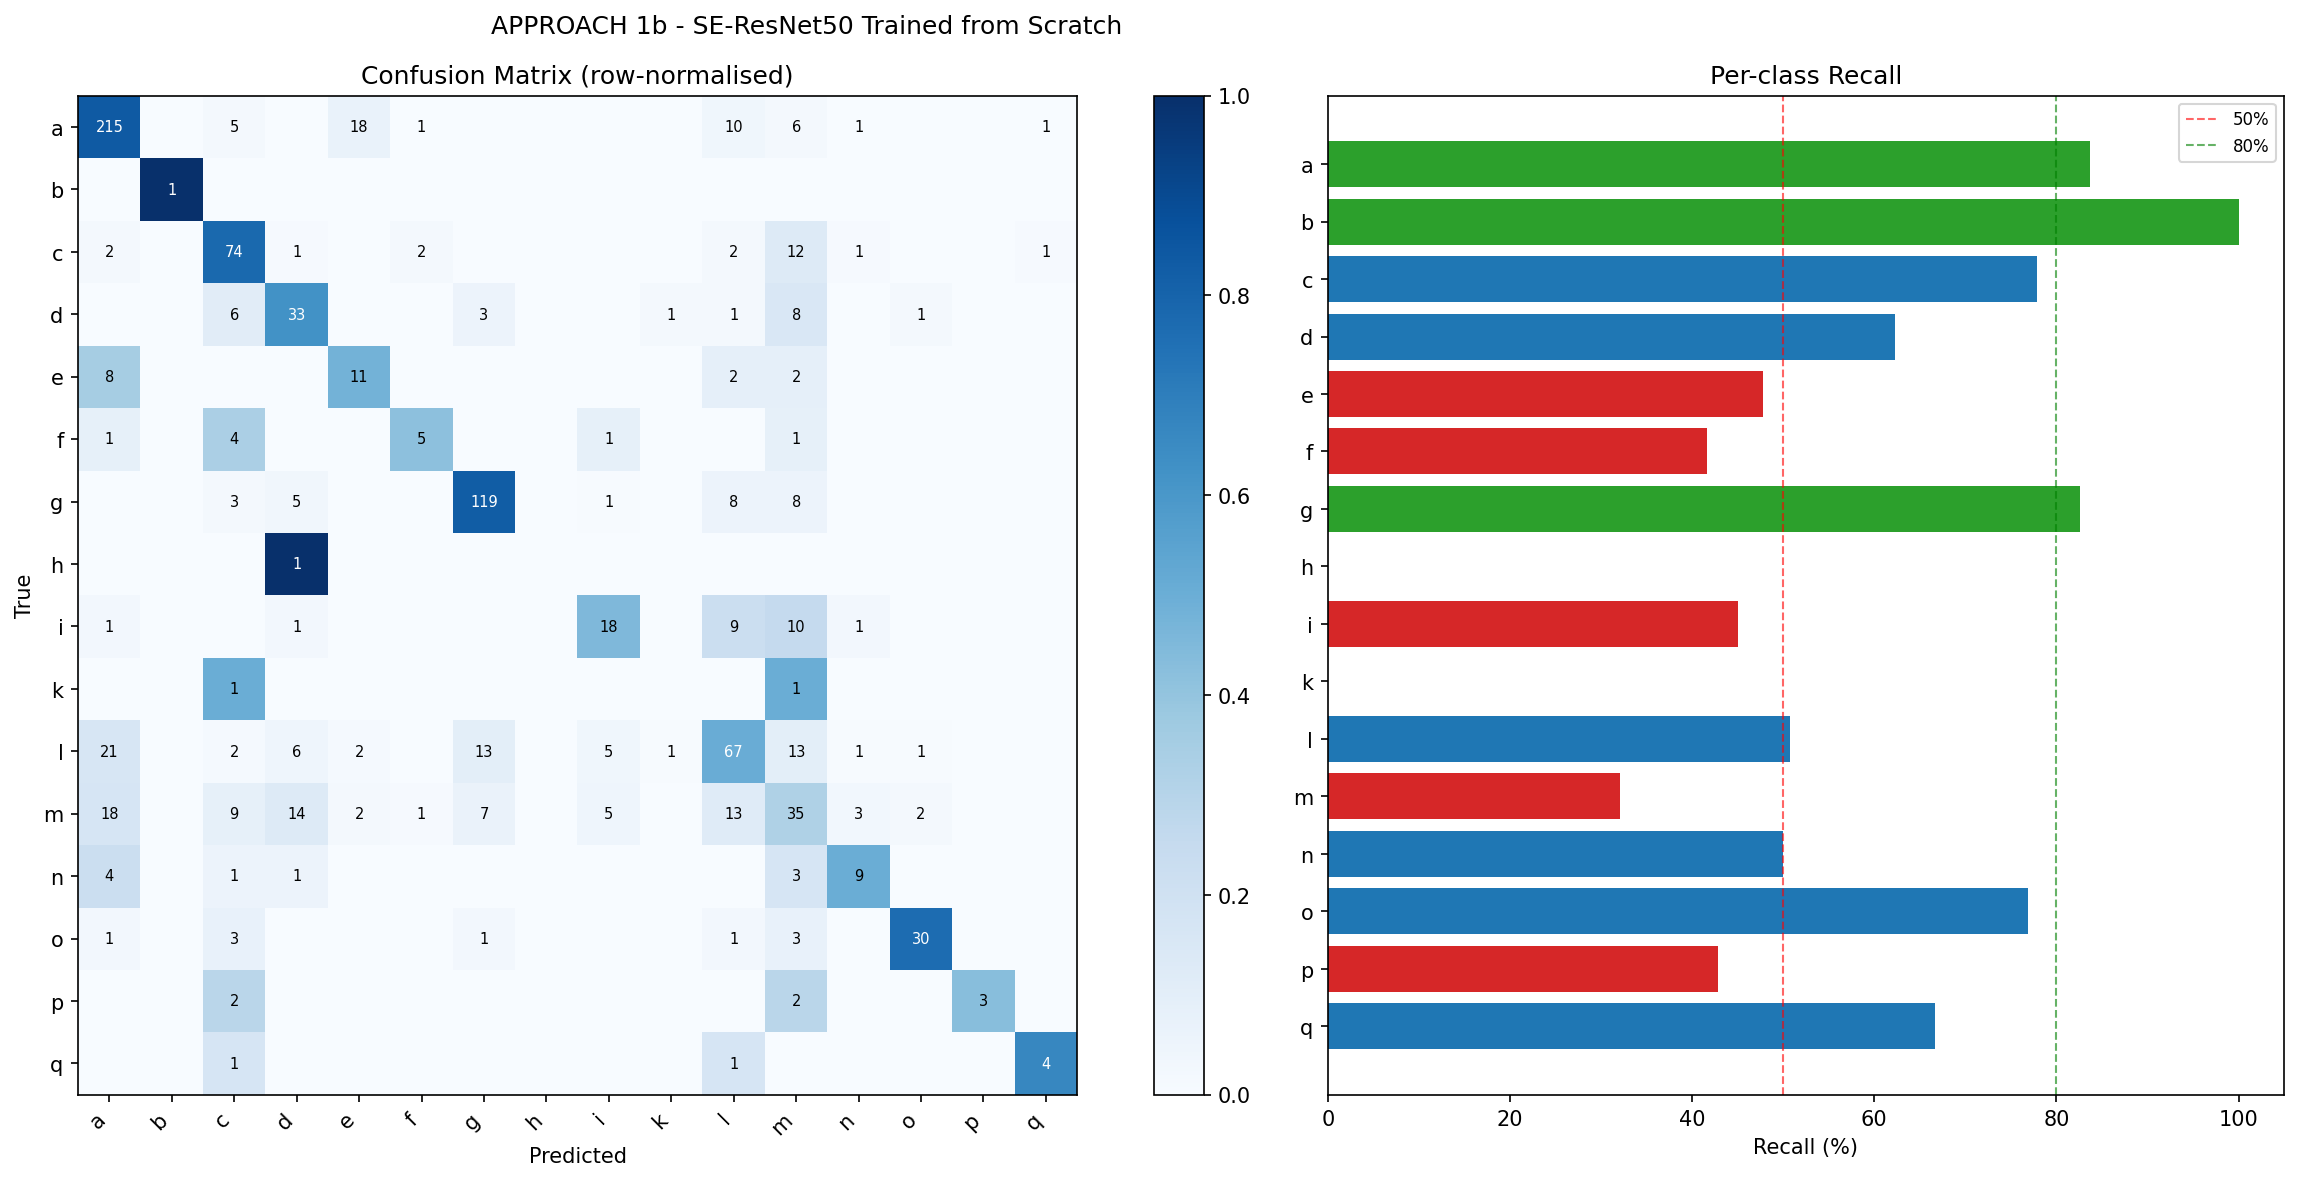
h and k collapse to 0% recall; m and i remain poorly separated.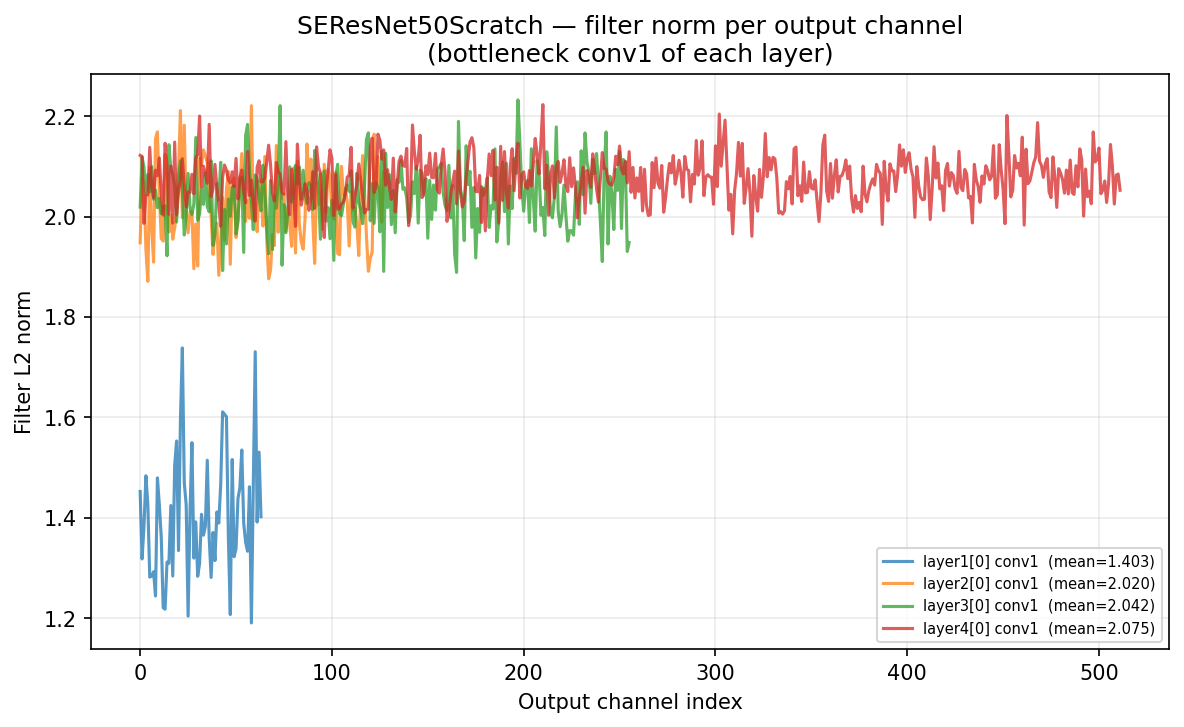
6Approach 2 — Fine-Tuned Pretrained Backbones
6.1A2a: ConvNeXt-Small Fine-Tuned
6.1.1Architecture and Transfer-Learning Strategy
ConvNeXt-Small [8] (49.86 M total parameters) is fine-tuned on the petri dish domain. Stages 0–1 (stem and first downsampling stage, 0.24 M parameters) are frozen; the remaining 49.61 M parameters receive discriminative learning rates:
The original adaptive average pooling is replaced by learnable GeM pooling (Section 5.1), and the ImageNet head is replaced by: Flatten → LayerNorm(768) → Dropout(0.30) → FC(512) → GELU → Dropout(0.15) → FC(16). The layer-group learning-rate scheme is depicted in Figure 11.
frozenη = 0Features[2]6×10⁻⁶Features[3–5]1.8×10⁻⁵Features[6–7]6×10⁻⁵GeM Pool
+ Head3×10−4
6.1.2Training
- Optimizer: AdamW, weight decay = 2×10⁻⁴
- Scheduler: Linear warm-up (5 epochs) then CosineAnnealingLR (Tmax = 35, ηmin = 10−7)
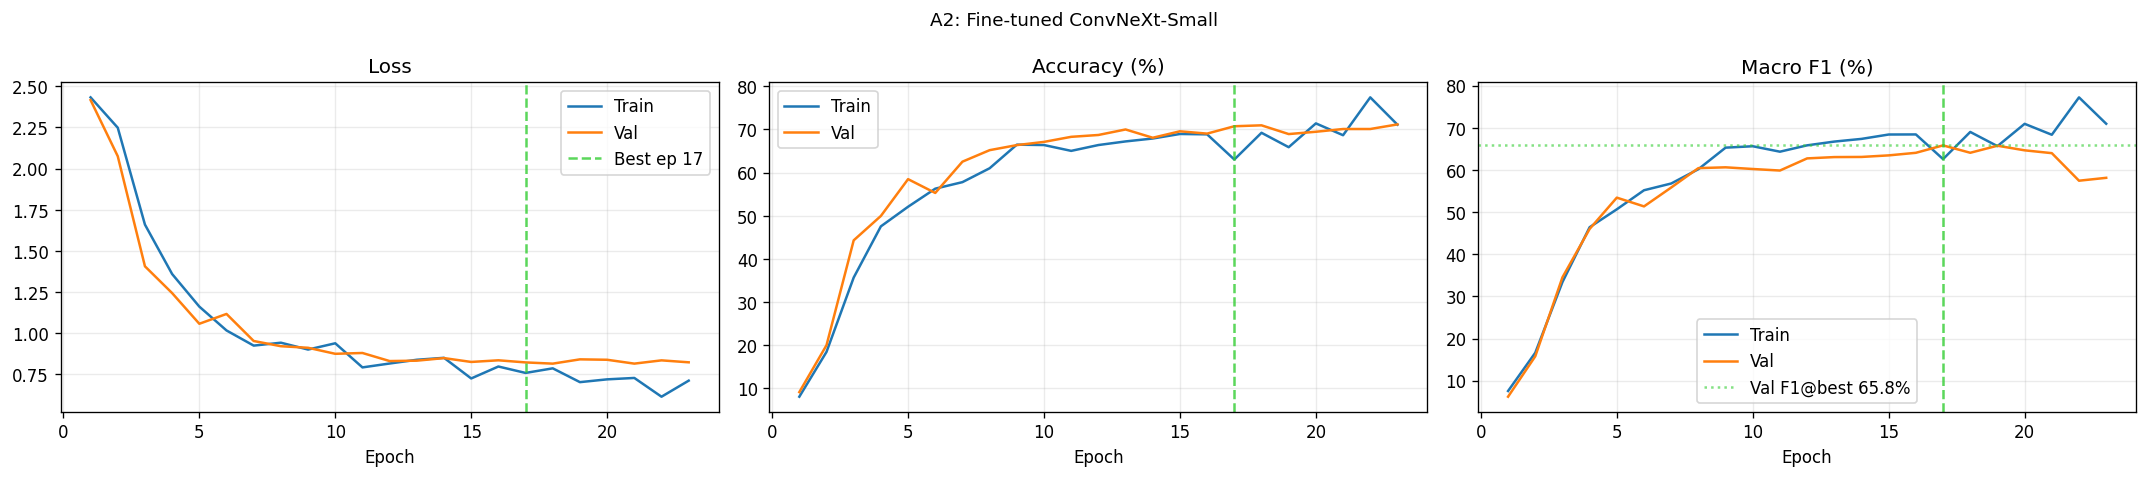
- Max epochs: 40; patience: 6; best checkpoint: epoch 17, macro F1 = 65.81%
6.1.3Results
A2a achieves the best accuracy (70.71%) and best macro F1 (65.81%) among all six approaches (Table 3, Figure 12, Figure 13). ImageNet pretraining yields +3.72 pp accuracy and +11.32 pp macro F1 over A1a. Higher filter norms relative to scratch CNNs confirm that ImageNet-initialised weights retain strong feature magnitudes after domain adaptation (Figure 14).
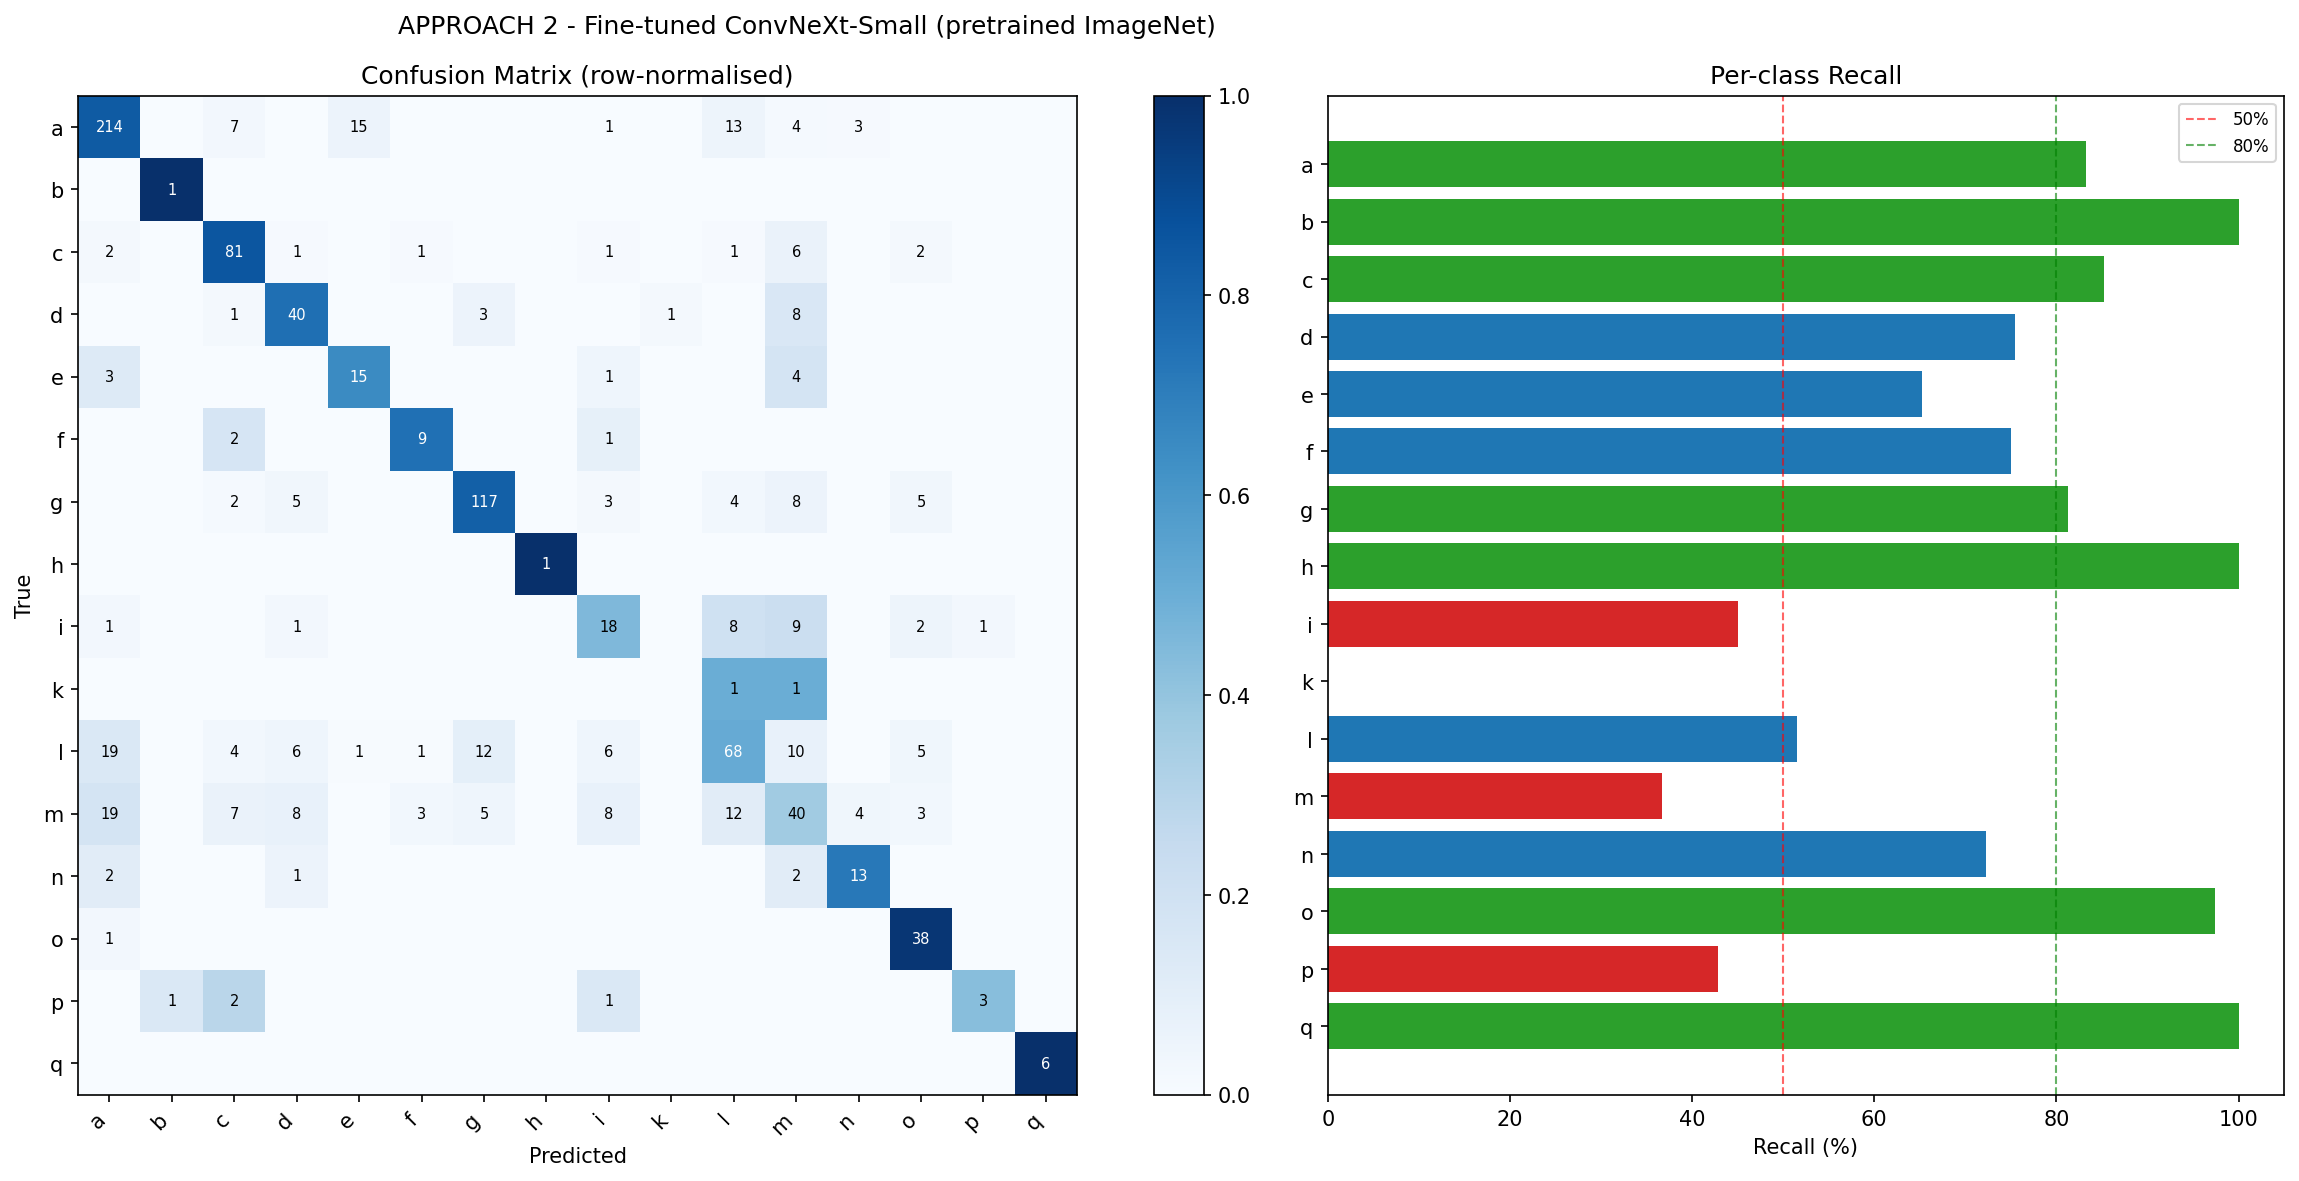
k remains at 0% recall and m at 36.70%; both overlap with morphologically similar classes.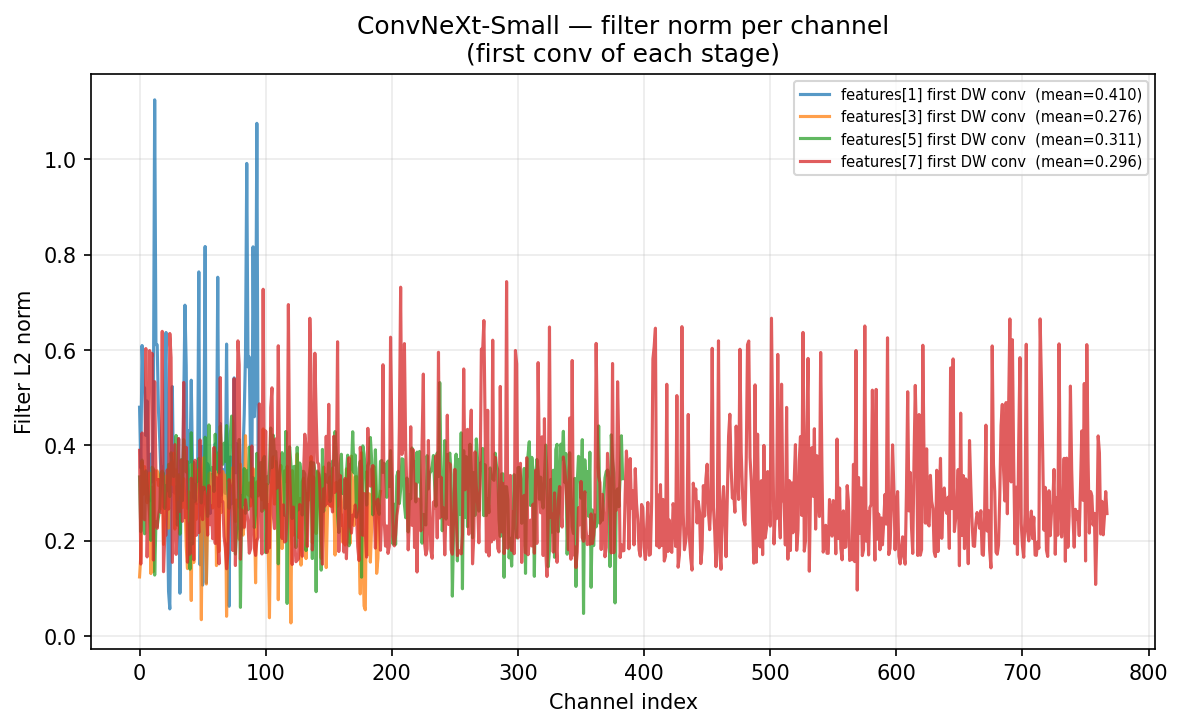
6.2A2b: Swin-T Fine-Tuned
6.2.1Architecture and Transfer-Learning Strategy
Swin Transformer (Tiny) [7] (27.92 M total parameters) uses hierarchical windowed self-attention with shifted windows, producing a 768-d representation. Features 0–2 (patch embedding, Stage 1, first downsampling, 0.30 M parameters) are frozen; features 3–7, the layer norm, and the custom head receive discriminative rates:
The original classification head is replaced by: LayerNorm(768) → Dropout(0.30) → FC(512) → GELU → Dropout(0.15) → FC(16). The layer-group learning-rate scheme is depicted in Figure 15.
frozenη = 0Features[3]3×10⁻⁶Features[4–5]1.8×10⁻⁵Features[6–7]
+ LayerNorm6×10−5Custom
Head3×10−4
6.2.2Training
- Optimizer, scheduler and stopping rule: as A2a (Section 6.1)
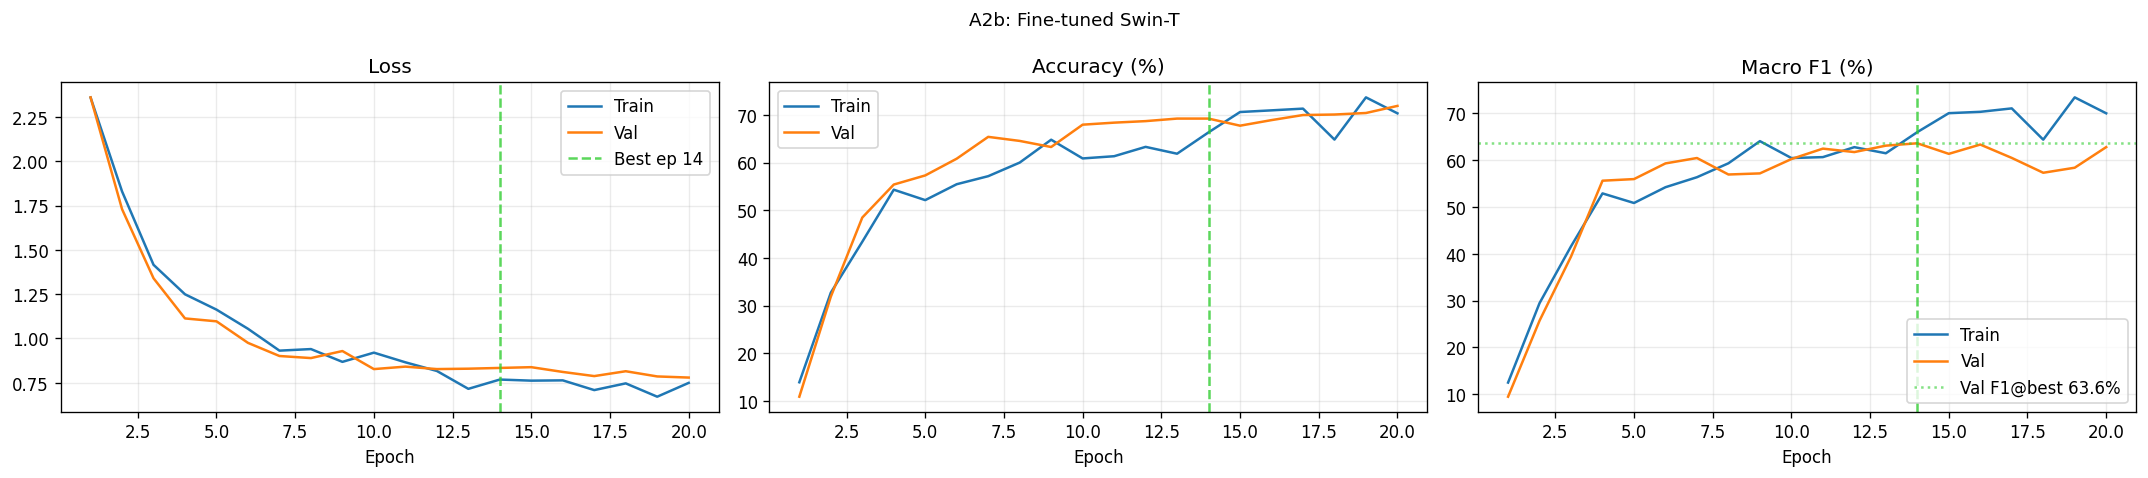
- Best checkpoint: epoch 14, held-out macro F1 = 63.59%
6.2.3Results
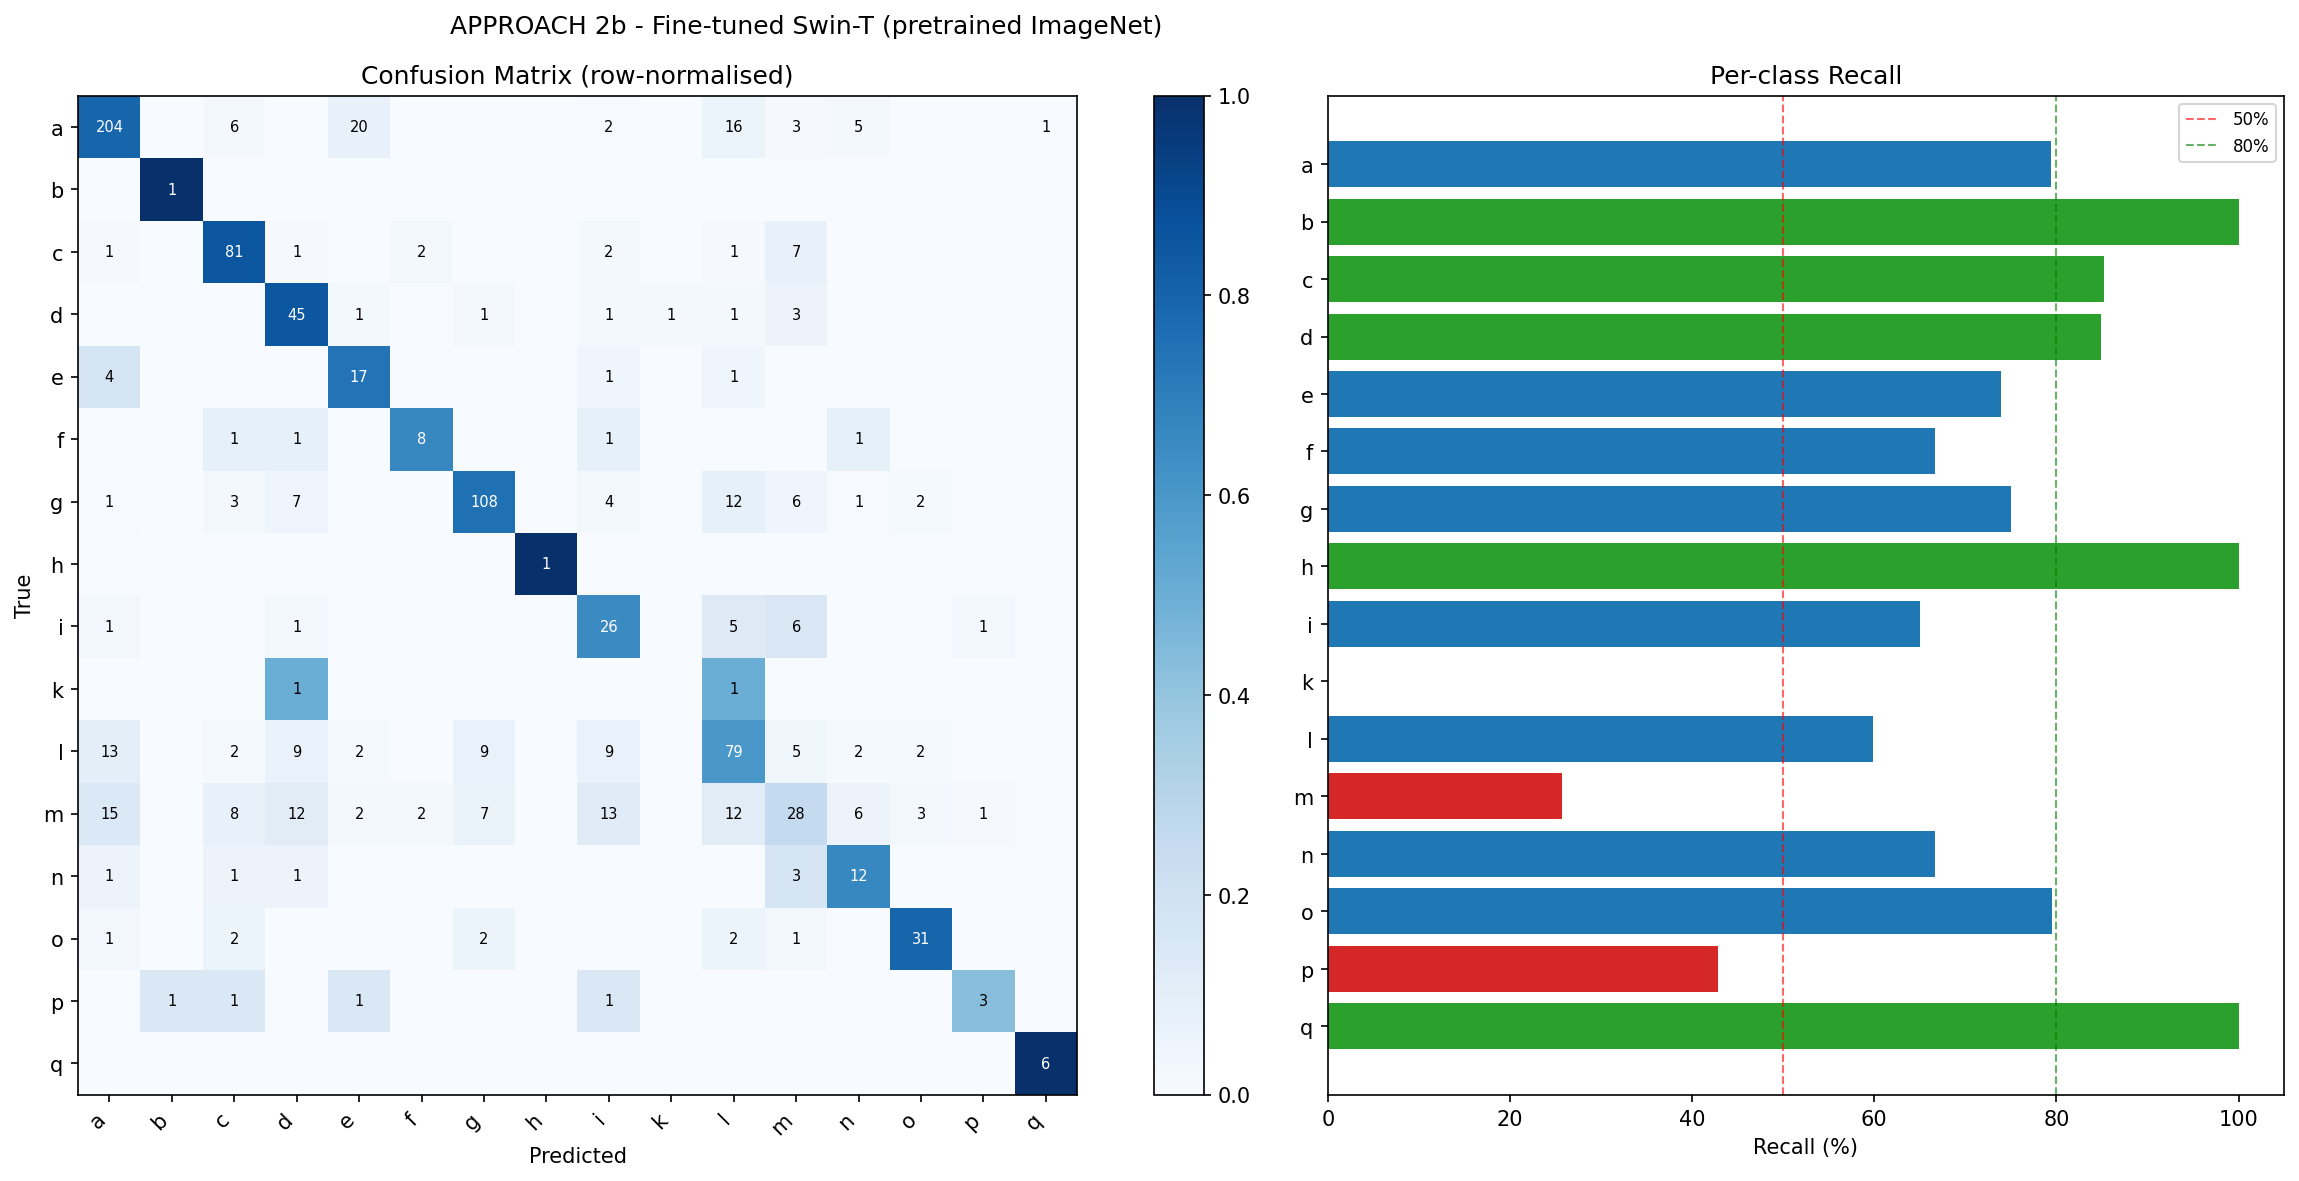
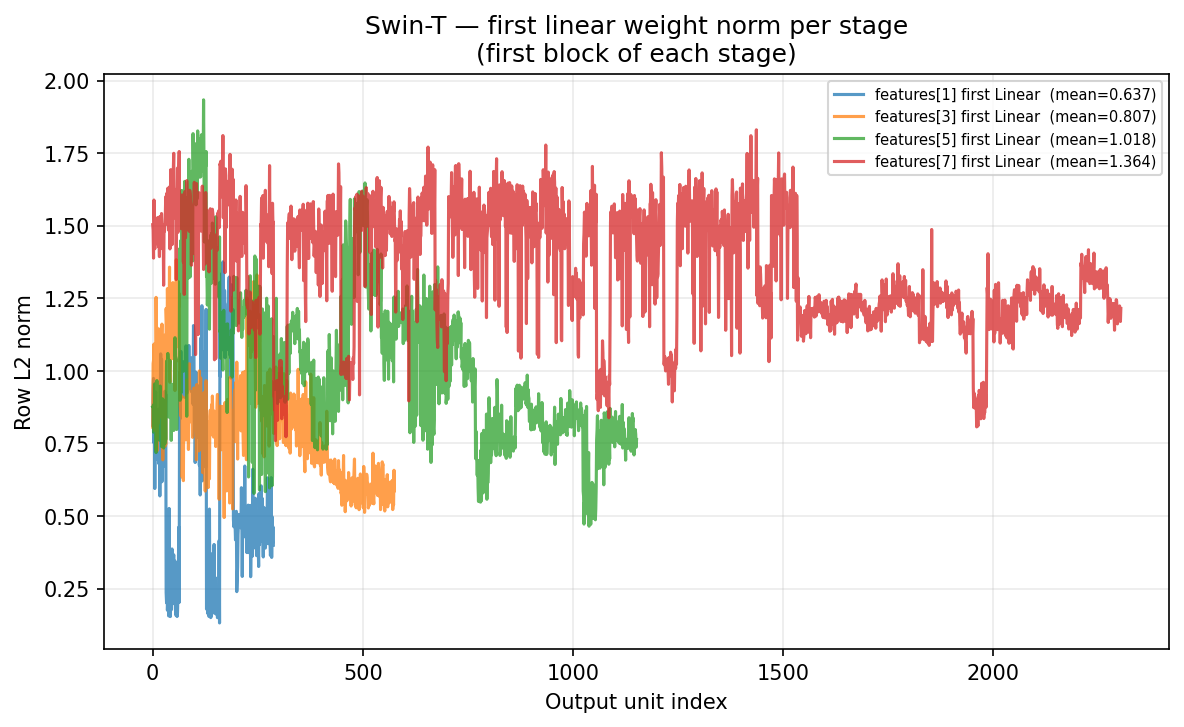
A2b achieves 69.22% accuracy and 63.59% macro F1, trailing A2a by 1.49 pp accuracy and 2.22 pp macro F1 (Table 3, Figure 16, Figure 17). Class k (0% recall) is the sole persistent failure. A2b does retain a 7 pp F1 advantage over A2a on class i, while A2a excels on n (+15 pp) and m (+7 pp). The sharp norm increase at features[7] shows the deepest unfrozen stage specialises most strongly after fine-tuning (Figure 18).
7Approach 3 — Pretrained Embeddings + RBF-SVM
The fine-tuned backbones are used as frozen feature extractors; their 768-d representations are standardised (StandardScaler [10]) and classified with a balanced RBF-SVM [13] (class_weight="balanced"). Hyperparameters C and γ are selected by 3-fold cross-validation over C ∈ {0.1, 0.5, 1, 5, 10} and γ ∈ {scale, 5×10⁻⁴, 10−3}, optimising macro F1. The procedure is given in Listing 4.
@torch.no_grad()
def embed(backbone: nn.Module, loader: DataLoader) -> np.ndarray:
    # The fine-tuned backbone, frozen, up to its pooled 768-d features.
    backbone.eval()
    return np.concatenate([backbone(x).cpu().numpy() for x, _ in loader])

Z_train, Z_test = embed(backbone, train_loader), embed(backbone, test_loader)

svm = make_pipeline(StandardScaler(),
                    SVC(kernel="rbf", class_weight="balanced"))
grid = GridSearchCV(svm,
                    {"svc__C": [0.1, 0.5, 1, 5, 10],
                     "svc__gamma": ["scale", 5e-4, 1e-3]},
                    cv=3, scoring="f1_macro")
grid.fit(Z_train, y_train)      # refits the best (C, gamma) on all of Z_train
y_pred = grid.predict(Z_test)7.1A3a: ConvNeXt-Small Embeddings + SVM
backbone (frozen)feature mapsGeM Pool768-dStandard
Scalerμ = 0, σ = 1RBF-SVM
C = 52603 SVsClass
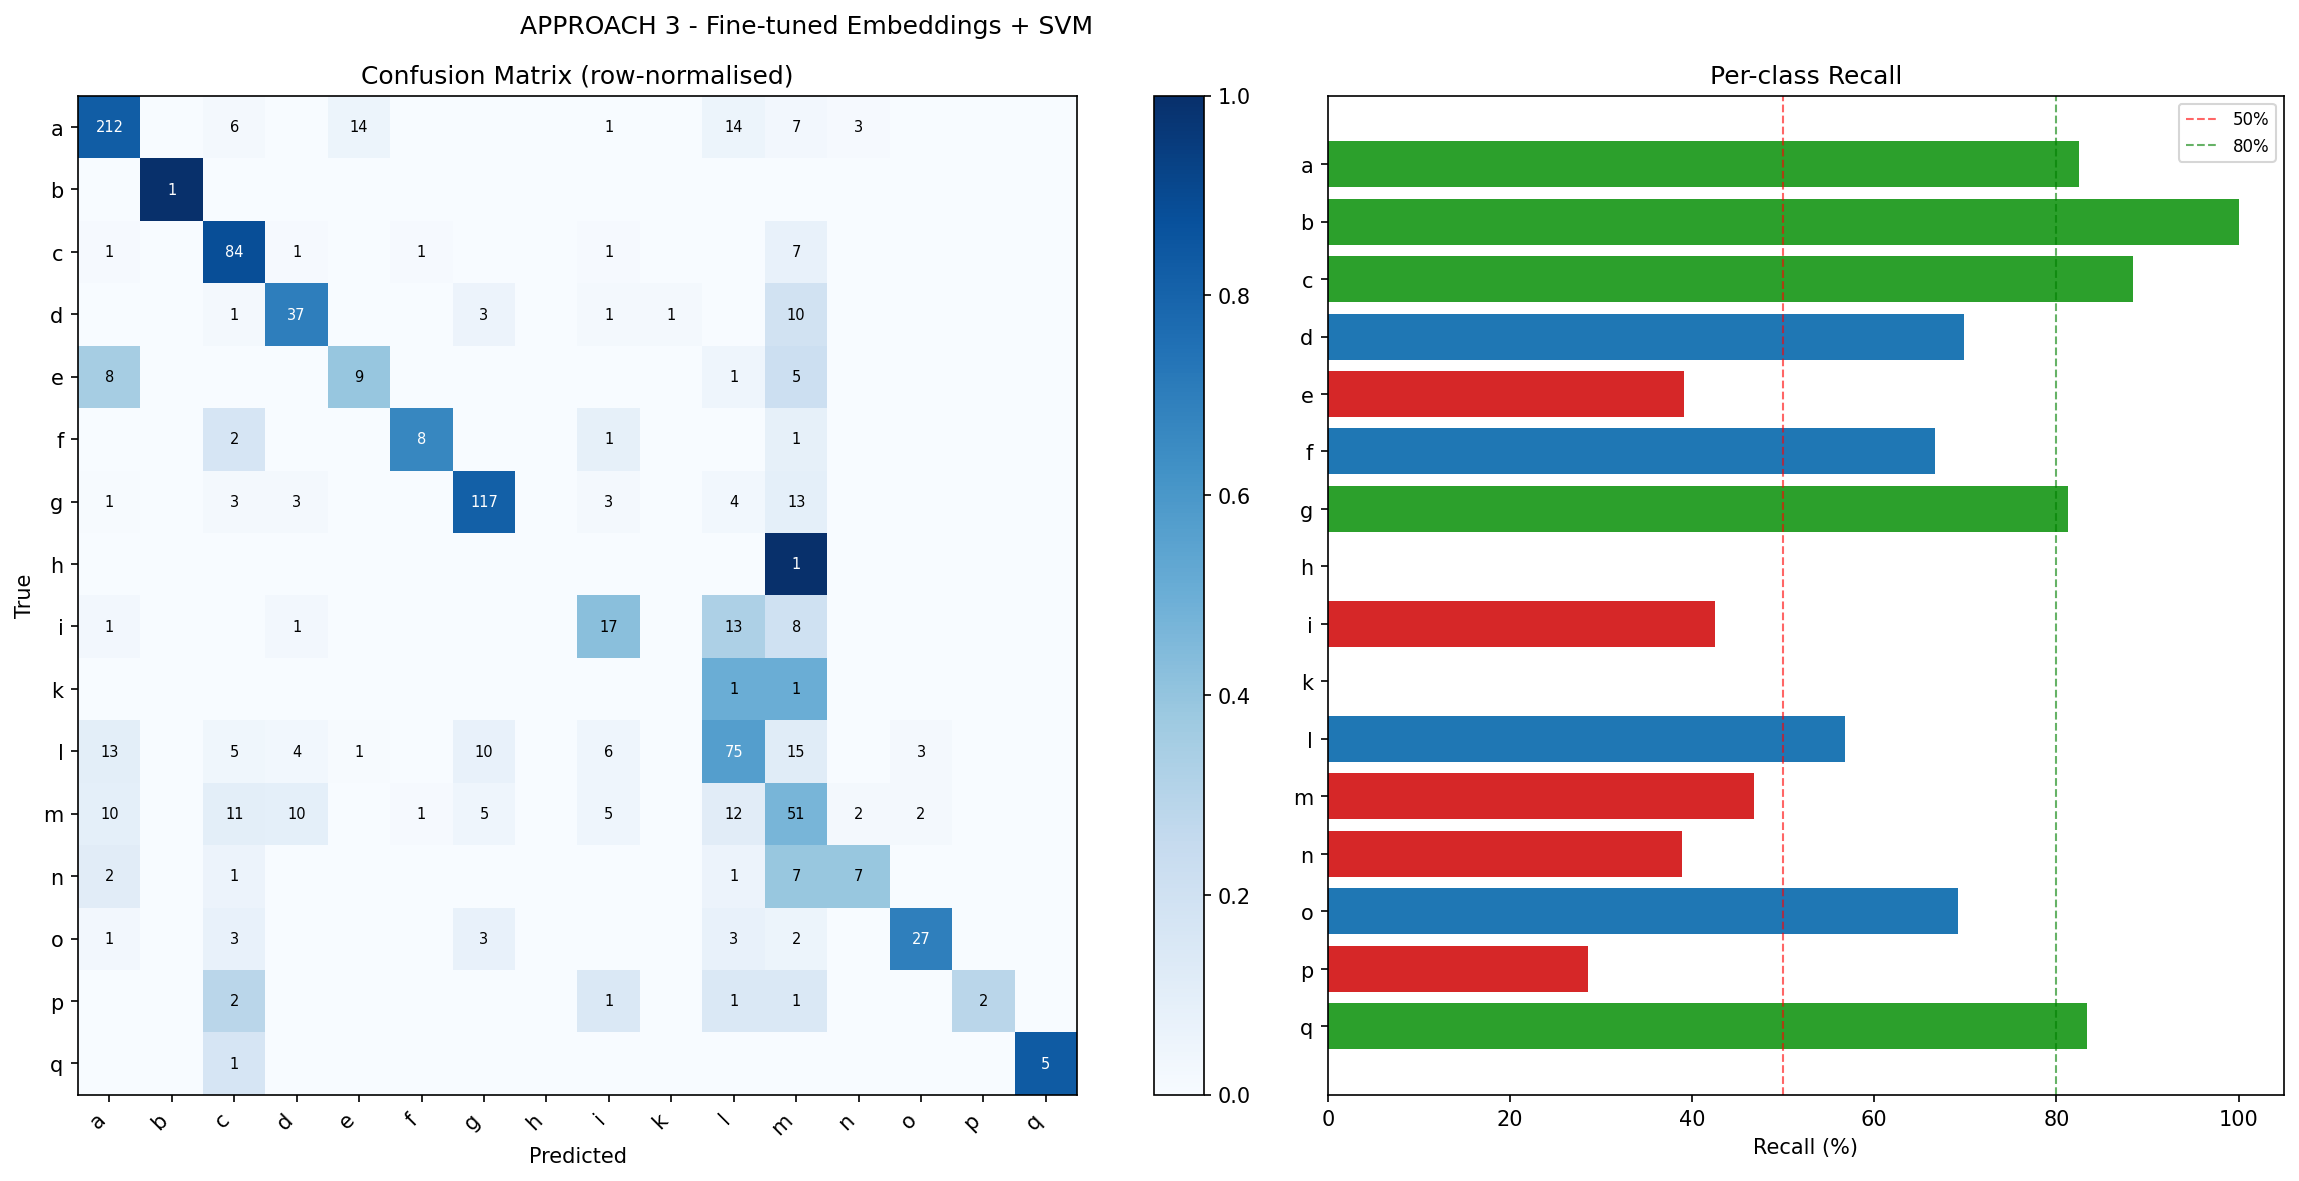
Grid-search CV yields macro F1 = 0.8723 (see Figure 19 for hyperparameters). Results in Table 3 and Figure 20.
The CV score sits far above the 58.01% held-out macro F1 because the folds are drawn from the same training images the backbone was fine-tuned on: their embeddings are more separable than those of images the backbone has never seen. It is used only to rank hyperparameters, not as an estimate of test performance.
7.2A3b: Swin-T Embeddings + SVM
8Comparative Analysis
8.1Overall Performance
| Metric | A1a | A1b | A2a | A2b | A3a | A3b |
|---|---|---|---|---|---|---|
| Scratch CNN | Scratch SE-R50 | ConvNeXt FT | Swin-T FT | ConvNeXt+SVM | Swin-T+SVM | |
| Accuracy | 66.99% | 66.45% | 70.71% | 69.22% | 69.44% | 70.61% |
| Macro Prec. | 53.38% | 58.43% | 64.51% | 61.36% | 63.35% | 64.05% |
| Macro Recall | 57.06% | 53.77% | 69.45% | 69.04% | 55.87% | 55.78% |
| Macro F1 | 54.49% | 55.07% | 65.81% | 63.59% | 58.01% | 58.57% |
| Weighted F1 | 66.46% | 66.16% | 70.14% | 68.83% | 69.46% | 70.47% |
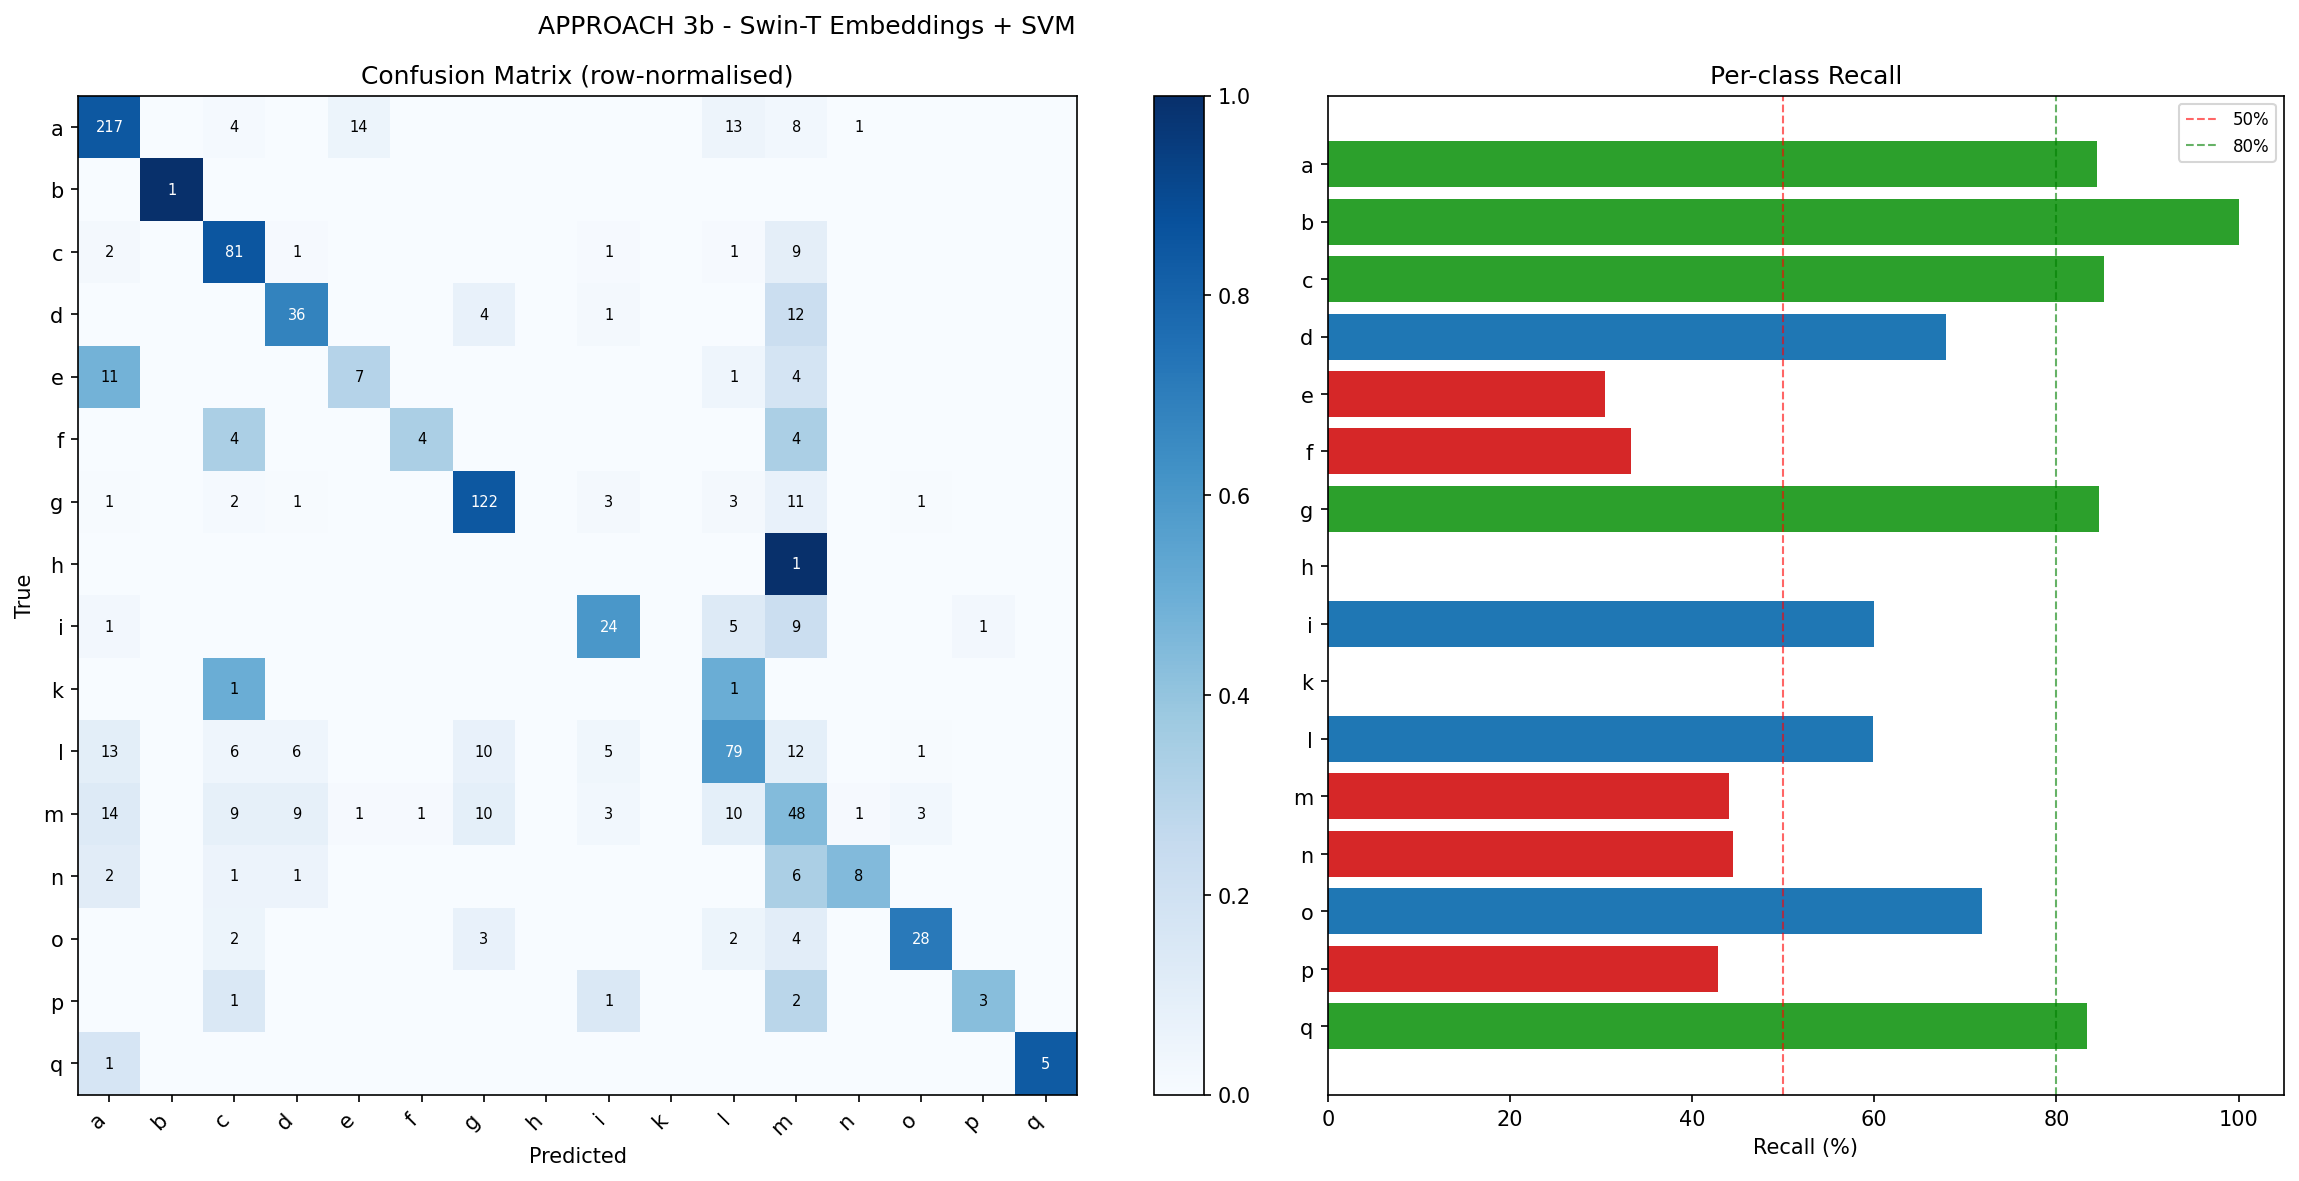
A2a leads on accuracy (70.71%), macro precision, macro recall, and macro F1 (65.81%). A3b achieves the highest weighted F1 (70.47%) but trails A2a by 7.24 pp macro F1. Both pretrained backbones substantially outperform scratch CNNs; the SVM approaches match or exceed fine-tuned accuracy but trail by 7–8 pp macro F1.
8.2Per-Class Analysis
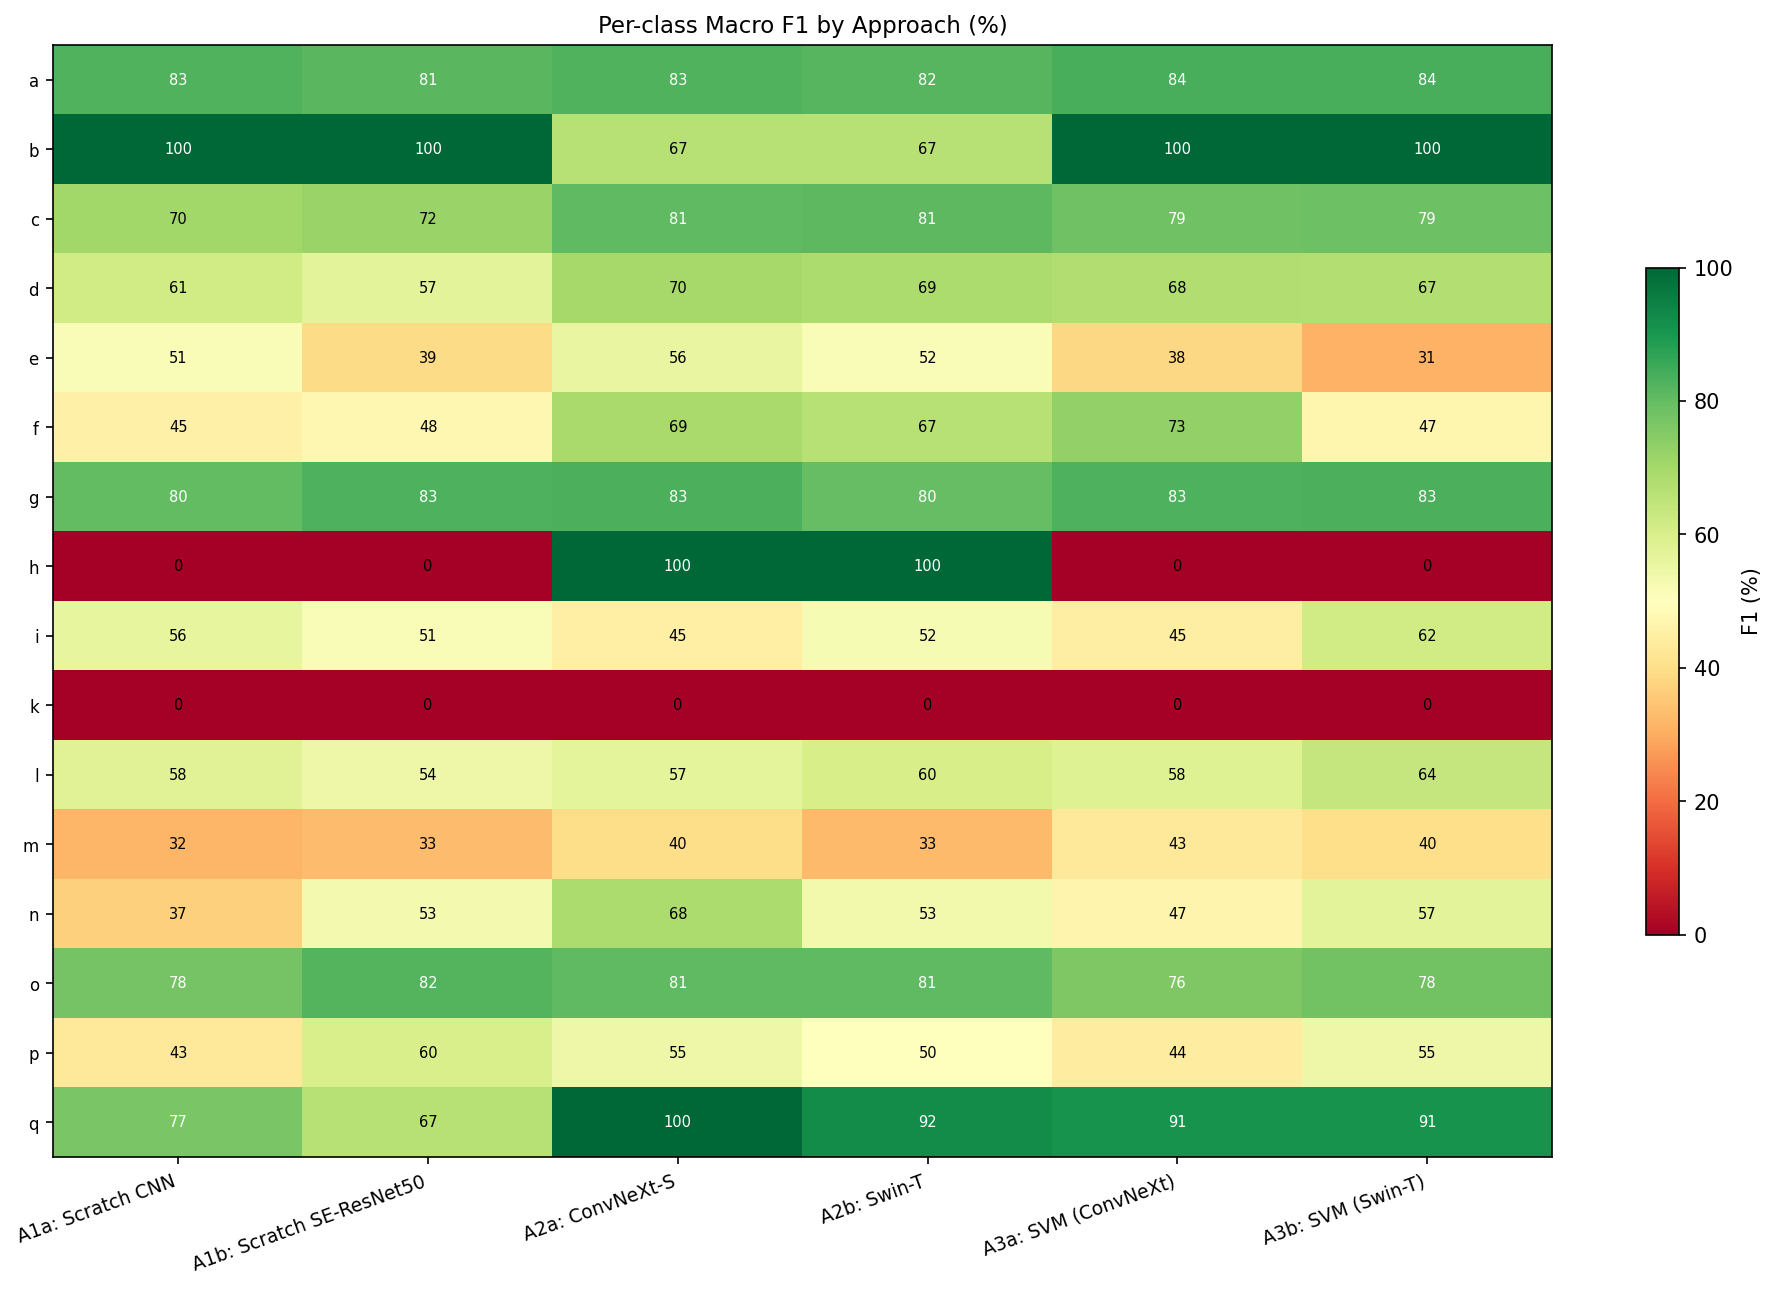
Several patterns emerge from Figure 22:
- Consistently easy (
a,b,g,o): high F1 across all approaches. Large sample count (a,g) or visually distinctive morphology (b,o). - Consistently hard (
k,m,i): ≤ 52% F1 for all approaches. t-SNE (Figure 23) confirms that their embeddings overlap with neighbouring classes. - Class
h(5 training samples): 100% recall under A2a and A2b, 0% under every other approach (see Section 9). - A2a over A2b for
n(+15.1 pp F1),m(+7.1 pp), andq(+7.7 pp): ConvNeXt's depthwise convolutions better capture the texture patterns distinguishing these classes. A2b retains an advantage on classi(+7.0 pp).
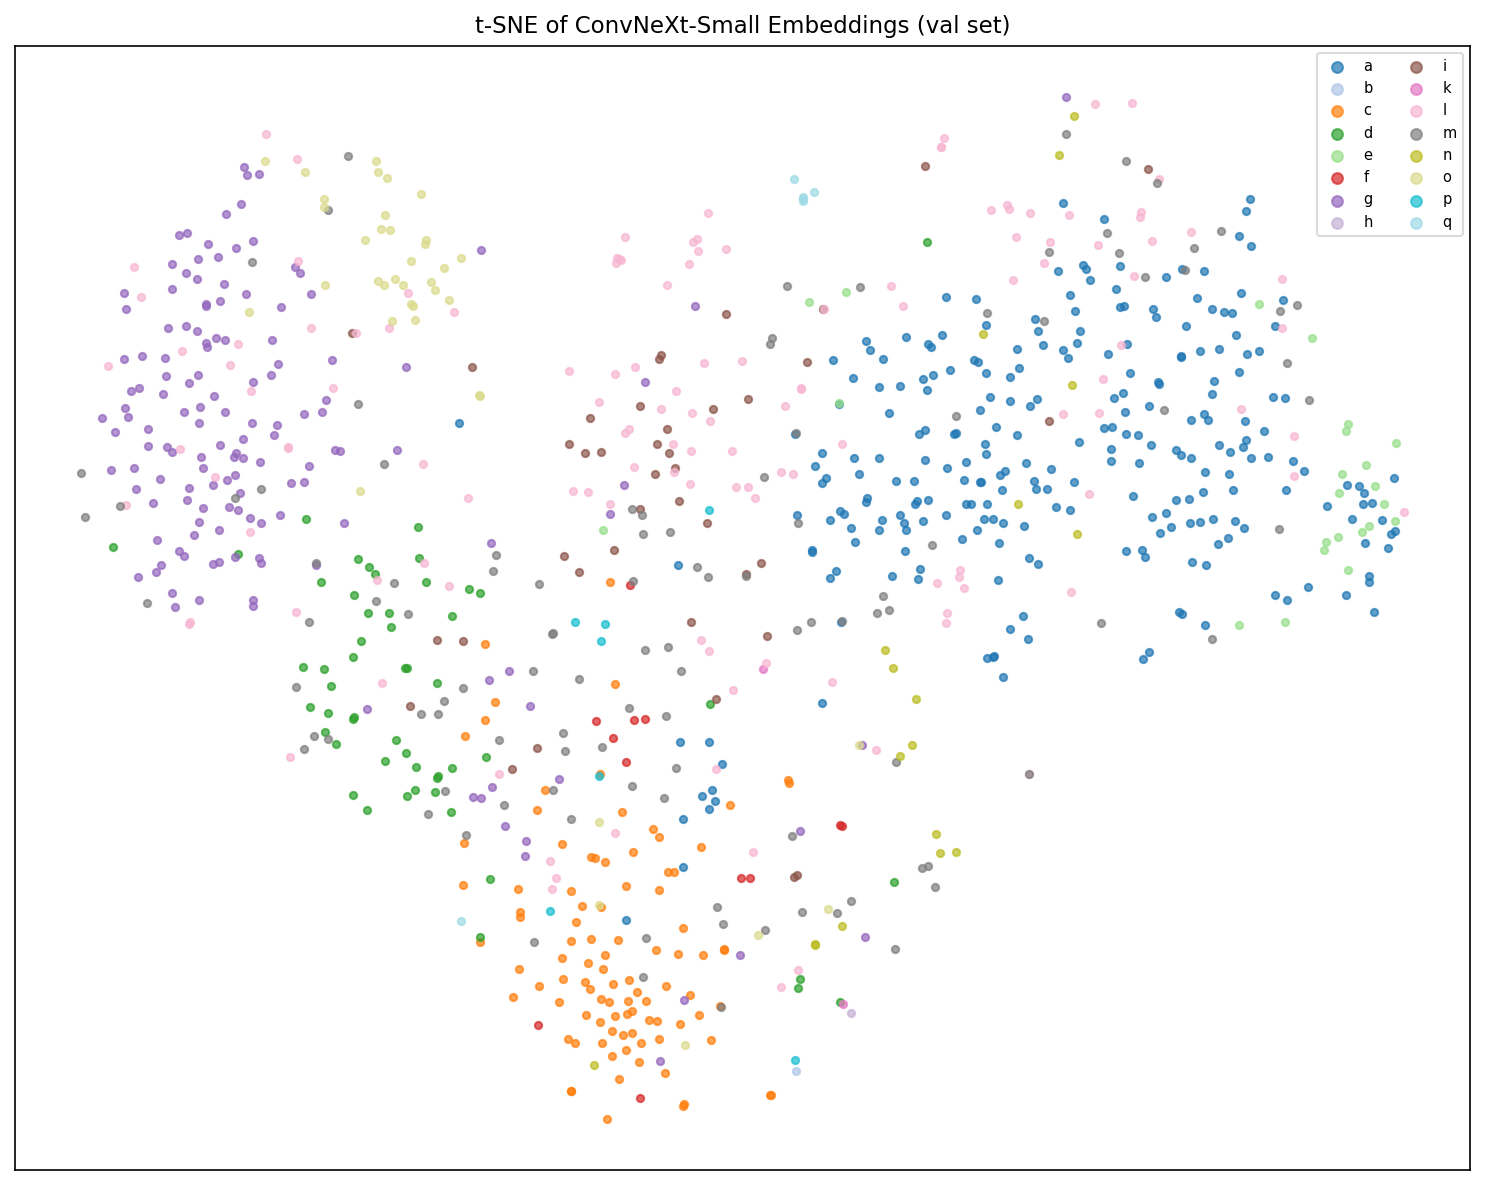
d/i and l/m form intermixed regions, explaining their persistently low recall across all approaches.9Discussion
Why SVM classifiers underperform their backbone fine-tuned models on macro F1. A3a trails A2a by 7.8 pp macro F1; A3b trails A2b by 5.0 pp, despite using embeddings from the same frozen backbones. Two effects compound: (1) the SVM's margin objective prioritises precision over recall on rare classes (f: 80% precision but 33–67% recall in A3a/A3b); (2) the balanced class-weight flag cannot recover rare classes (h, k) whose frozen embeddings overlap majority-class clusters.
Why fine-tuned backbones dominate scratch CNNs on ultra-rare classes. Class h (5 training samples) achieves 100% recall under A2a/A2b but 0% under all scratch and SVM approaches. The ImageNet prior encodes low-level visual structure that generalises immediately from a single example; scratch CNNs lack this prior and collapse the class into a majority-class cluster, an effect that neither data augmentation nor WeightedRandomSampler can overcome with only 5 training samples.
10Conclusion
Six approaches were evaluated on the same 939-sample held-out test set. Fine-tuned ConvNeXt-Small (A2a) is the pick, with the best accuracy (70.71%) and macro F1 (65.81%). The embedding + SVM variants match its accuracy but give up 7–8 pp of macro F1 on the rare classes, and the scratch CNNs trail on both.
References
- [1]Antoni Buades, Bartomeu Coll, and J-M Morel. A non-local algorithm for image denoising. In 2005 IEEE computer society conference on computer vision and pattern recognition (CVPR'05), volume 2, pages 60–65. Ieee, 2005.
- [2]Kaiming He, Xiangyu Zhang, Shaoqing Ren, and Jian Sun. Identity mappings in deep residual networks. In European conference on computer vision, pages 630–645. Springer, 2016.
- [3]Jie Hu, Li Shen, and Gang Sun. Squeeze-and-excitation networks. In Proceedings of the IEEE conference on computer vision and pattern recognition, pages 7132–7141, 2018.
- [4]Gao Huang, Yu Sun, Zhuang Liu, Daniel Sedra, and Kilian Q Weinberger. Deep networks with stochastic depth. In European conference on computer vision, pages 646–661. Springer, 2016.
- [5]Glenn Jocher, Ayush Chaurasia, and Jing Qiu. Ultralytics YOLOv8, 2023. Version 8.0.0, https://github.com/ultralytics/ultralytics.
- [6]Tsung-Yi Lin, Priya Goyal, Ross Girshick, Kaiming He, and Piotr Dollár. Focal loss for dense object detection. In Proceedings of the IEEE international conference on computer vision, pages 2980–2988, 2017.
- [7]Ze Liu, Yutong Lin, Yue Cao, Han Hu, Yixuan Wei, Zheng Zhang, Stephen Lin, and Baining Guo. Swin transformer: Hierarchical vision transformer using shifted windows. In Proceedings of the IEEE/CVF international conference on computer vision, pages 10012–10022, 2021.
- [8]Zhuang Liu, Hanzi Mao, Chao-Yuan Wu, Christoph Feichtenhofer, Trevor Darrell, and Saining Xie. A convnet for the 2020s. In Proceedings of the IEEE/CVF conference on computer vision and pattern recognition, pages 11976–11986, 2022.
- [9]Ilya Loshchilov and Frank Hutter. Decoupled weight decay regularization. arXiv preprint arXiv:1711.05101, 2017.
- [10]Fabian Pedregosa, Gaël Varoquaux, Alexandre Gramfort, Vincent Michel, Bertrand Thirion, Olivier Grisel, Mathieu Blondel, Peter Prettenhofer, Ron Weiss, Vincent Dubourg, et al. Scikit-learn: Machine learning in Python. Journal of machine learning research, 12:2825–2830, 2011.
- [11]Filip Radenović, Giorgos Tolias, and Ondřej Chum. Fine-tuning cnn image retrieval with no human annotation. IEEE transactions on pattern analysis and machine intelligence, 41(7):1655–1668, 2018.
- [12]Ali M Reza. Realization of the contrast limited adaptive histogram equalization (clahe) for real-time image enhancement. Journal of VLSI signal processing systems for signal, image and video technology, 38(1):35–44, 2004.
- [13]Ali Sharif Razavian, Hossein Azizpour, Josephine Sullivan, and Stefan Carlsson. Cnn features off-the-shelf: an astounding baseline for recognition. In Proceedings of the IEEE conference on computer vision and pattern recognition workshops, pages 806–813, 2014.
- [14]Laurens Van der Maaten and Geoffrey Hinton. Visualizing data using t-sne. Journal of machine learning research, 9(11), 2008.
- [15]Sanghyun Woo, Jongchan Park, Joon-Young Lee, and In So Kweon. Cbam: Convolutional block attention module. In Proceedings of the European conference on computer vision (ECCV), pages 3–19, 2018.