docs / getting-started
Web Monitor
Multi-tenant front-end monitoring: a browser SDK, a guarded ingest endpoint, and a GraphQL dashboard of issues, trends and alerts.
SaaS platform · Open source · MIT · 2025 – 2026
<script type="module"> import ObsPro from "/sdk/index.js"; const monitor = new ObsPro("obs_live_4f2c…", { baseUrl: "https://obs.example.com", // batches POST to /ingest sampleRate: 0.25, // performance only — errors are never sampled slowRequestMs: 3000, // also report slow successful calls }); const flow = monitor.startFlow("checkout"); flow.step("address"); // … later flow.complete(); // or fail("card_declined")</script>- Monitoring layers
- 4performance, errors, flows, custom
- Tests
- 236175 backend, 38 SDK, 23 dashboard
- Default ingest cap
- 6000/minevents per key
- Alert conditions
- 4each with cooldown
01 · Ingest
#Four guards before anything is written
A plain POST to /ingest — no preflight, and what sendBeacon sends on page hide. Each guard rejects a batch before it costs a database write.
API key → tenant
rejects an unknown key
Origin allowlist
rejects any other origin, or none
Rate limit
rejects a key over budget — charged per event, junk included
Batch validation
rejects over 500 events, or any field over its cap
02 · Issues
#Errors group into issues
Each error hashes to a signature with hourly counts and a status.
errors ingested, issues to look at
- Newfirst seen
- Resolvedclosed by a person
- Regressedreopened by the next matching error
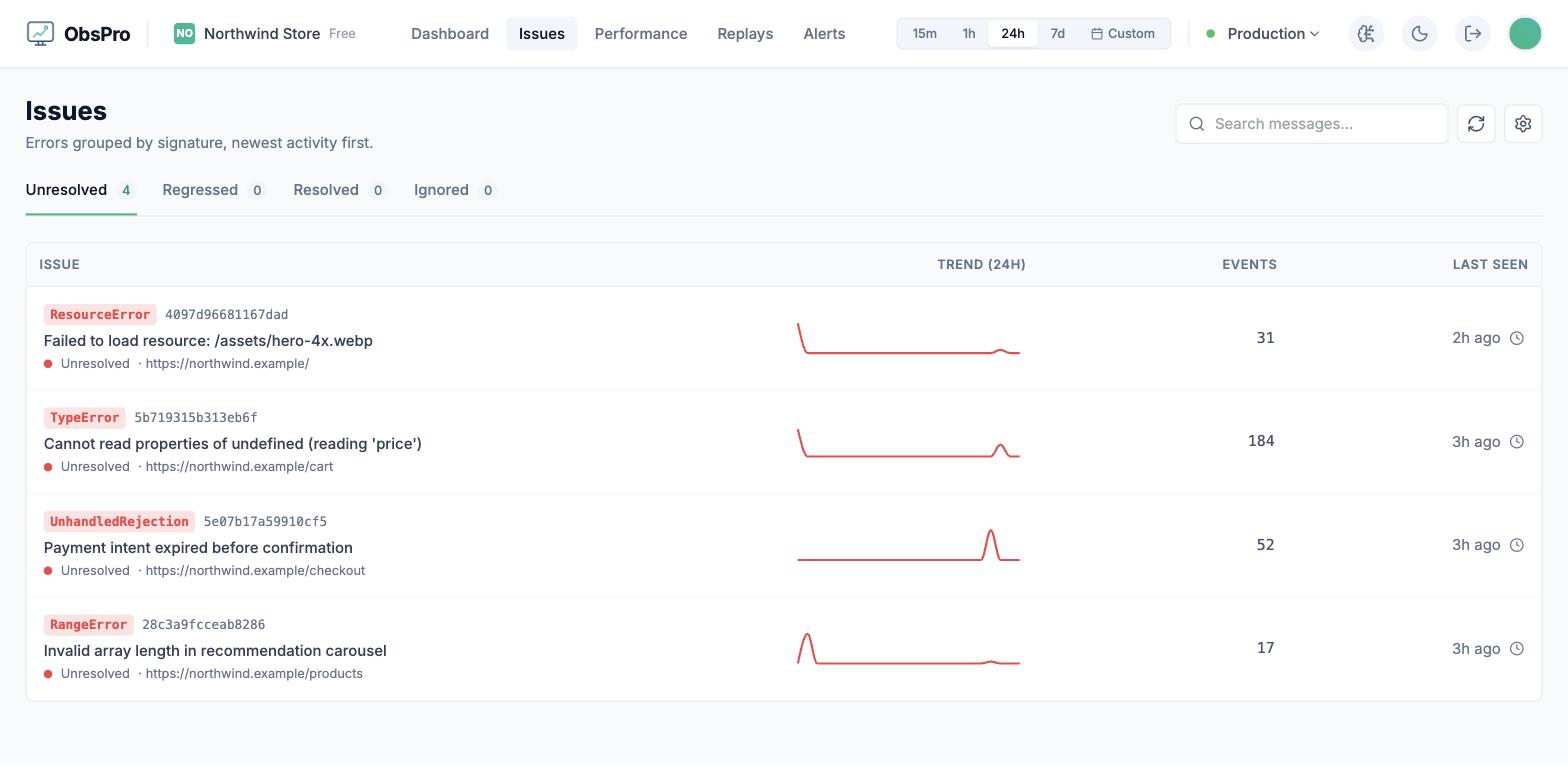
Issues — errors grouped by signature
284 errors grouped into 4 issues, each with a 24-hour trend.
03 · Alerts
#Evaluated on a timer, never on ingest
Otherwise an error spike becomes its own denial-of-service.
a burst of
500
errors costs
1
evaluation
| Rule | Watches |
|---|---|
| NewIssue | an issue seen for the first time |
| ErrorSpike | error count against a threshold |
| ErrorRate | errors as a share of events |
| SlowPageLoad | page load time against a threshold |
Each rule has a threshold and a cooldown, so a persistent condition alerts once. Windows under 20 events or 5 samples are ignored.
04 · Console
#What the dashboard shows
A local Docker run with a synthetic storefront reporting through the SDK.
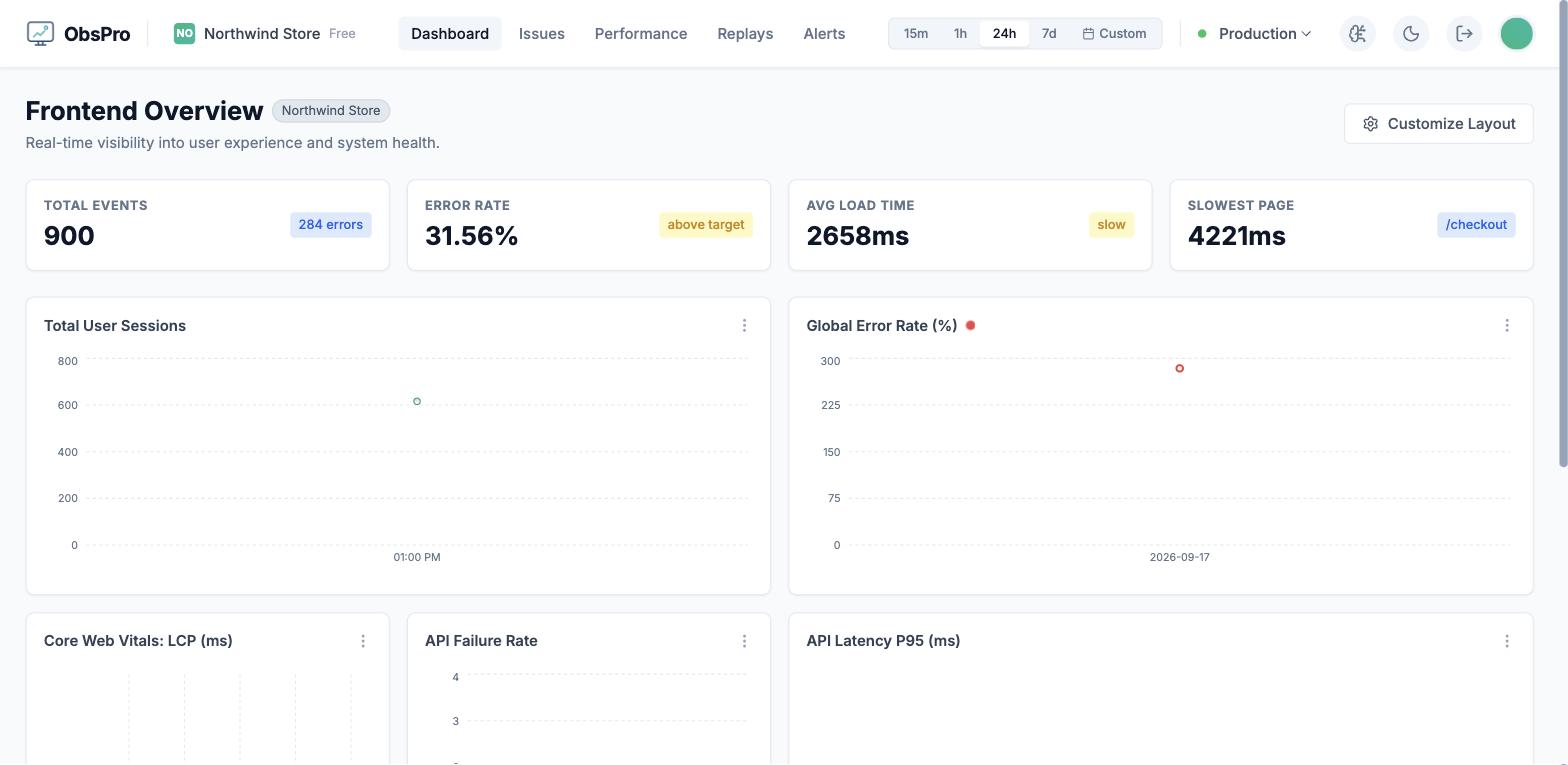
Frontend overview
900 events: error rate, load time and the slowest page.
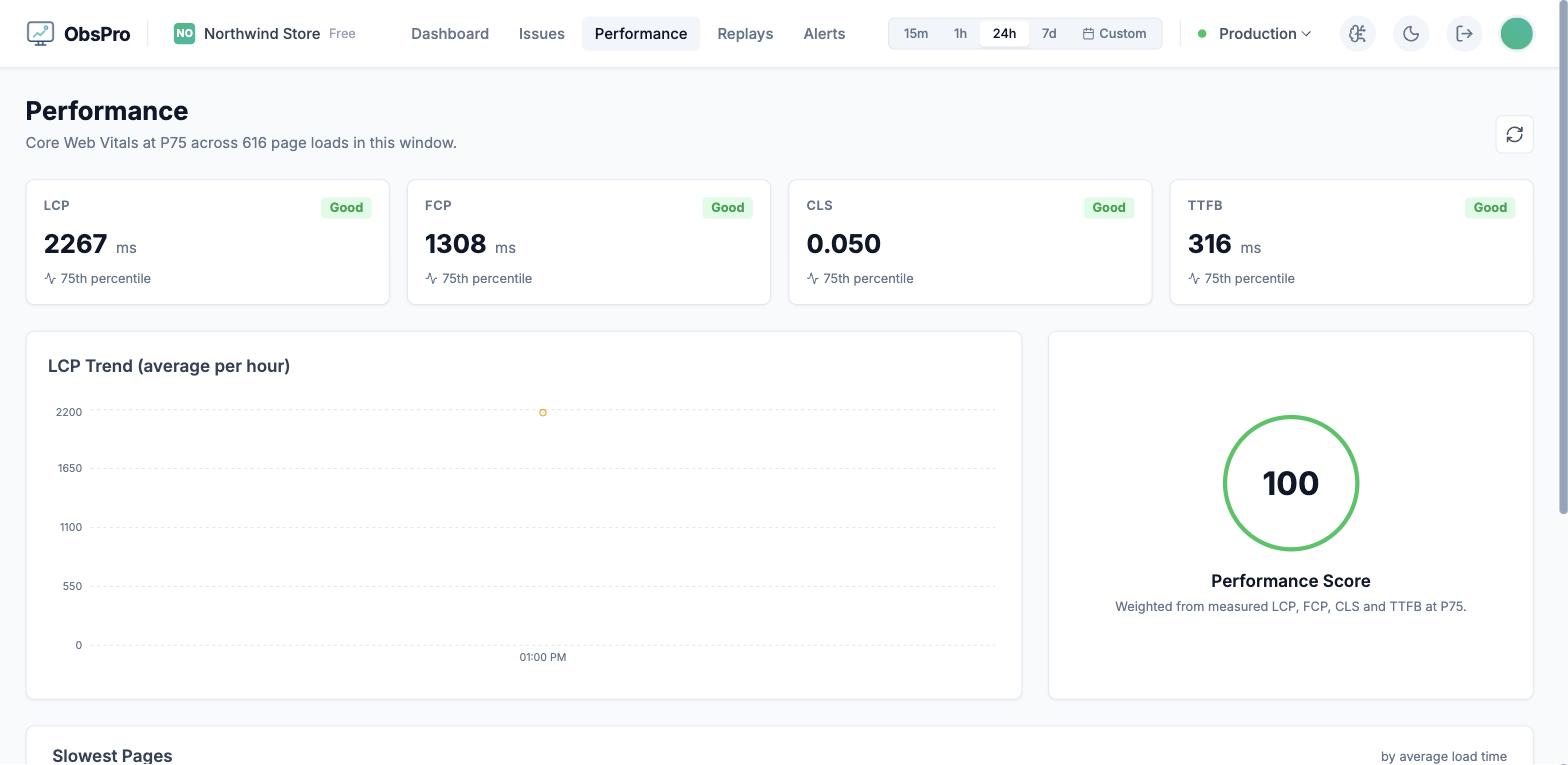
Core Web Vitals at P75
LCP, FCP, CLS and TTFB at P75 across 616 page loads.
05 · Architecture
#The whole system, drawn
The ingest path, and the work kept deliberately off it
Errors collapse to one atomic upsert per hash, so concurrent reports add up instead of racing; a retried batch is recognised by its id and skipped. Dashed lines run on the timer, off the ingest path.